🧑💻 Summary:
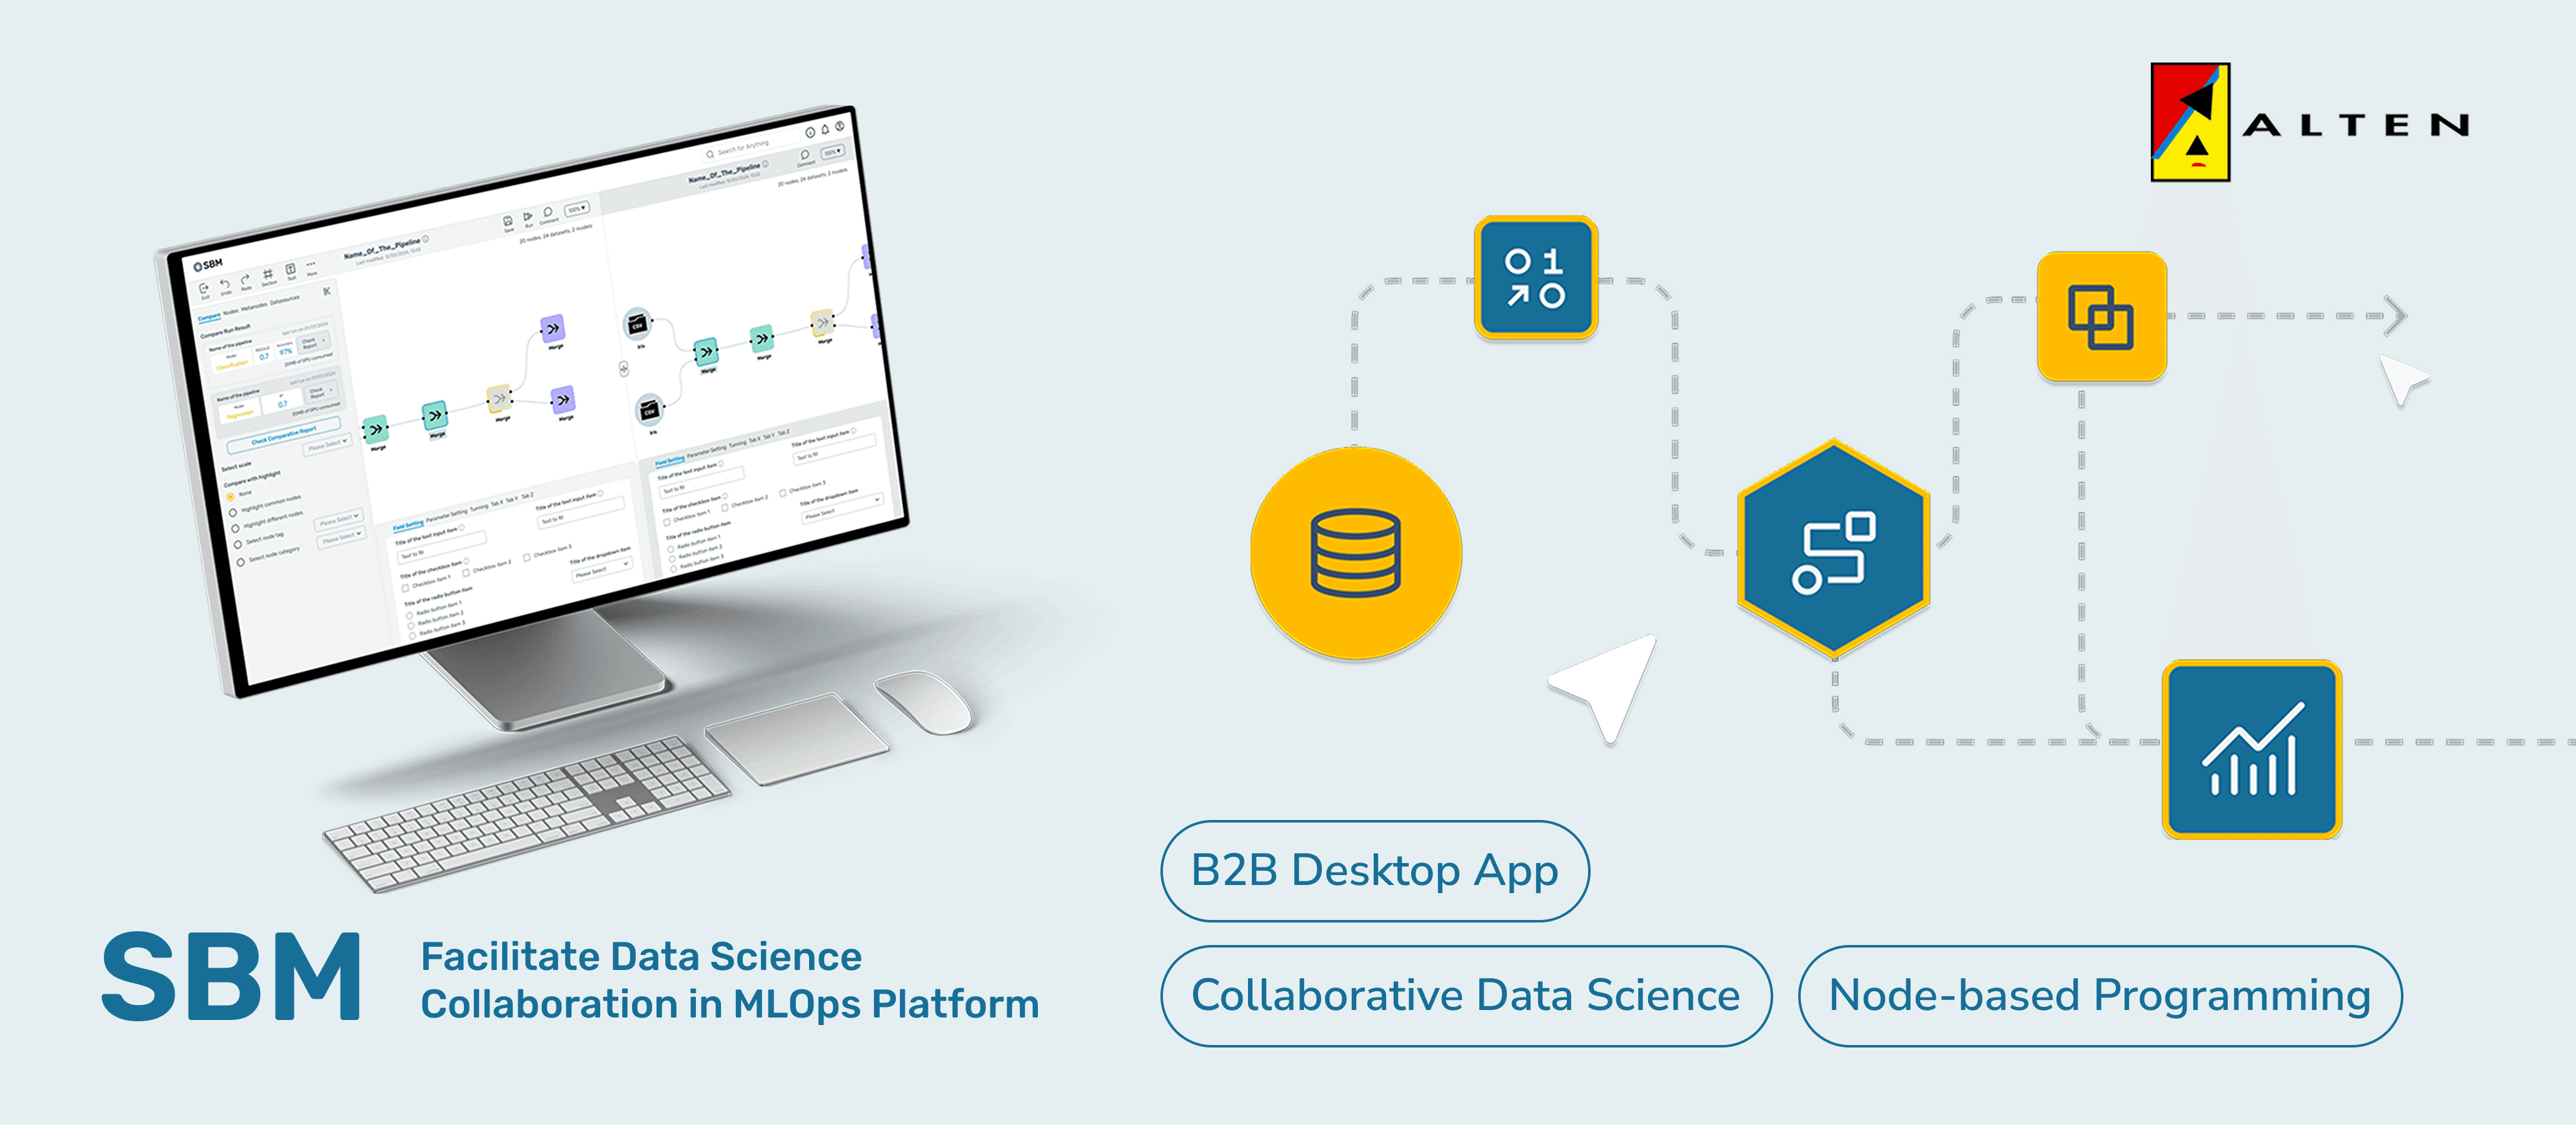
SBM, short for ‘Smart Behaviour Management’, is a project in Alten Lab Sophia Antipolis, it aims for creating a node-based programming tool for data science teams to build data pipeline and machine learning models in an easier way.
I worked as the project design lead while the final outcome is also my master research thesis. During these 6 months working with developers and data science experts, I redesigned all existing interfaces first, and then conducted an in-depth research focused on the collaboration between technical roles in the aspects of coordination, communication, and information sharing, which turned into 5+ newly initiated features beyond currently existing products in the industry.
As a result, testing sessions with target users largely validated the value of all of my proposed initiatives, and my design deliveries would be developed by engineers. (I also graduated with a score of 110/110)
P.S: If you are interested in my full thesis in pdf format, check it out from the button at the left : )
Process Overview
Context
About Alten Labs:
Alten is a french multinational consultancy company in technology and engineering, it has a department 'Alten Labs' mainly work as an incubation centre for creating innovative solutions for the company.
About the project SBM:
SBM, short for ‘Smart Behaviour Management’ is a tool based no-code digital platform (desktop) for data science teams who spend a long time on coding data pipelines to automate their workflow through connecting modular data processing algorithm components.
In the industry, this kind of tool also has a name called ‘MLOps platforms’. Some popular products are AzureML, Dataiku, KNIME, etc…
Part 1 - Primary Interface Redesign
When I joined the project, there was already a proof of value (POV) version of primary interfaces, which list out user's data science projects as well as necessary assets within them. The interfaces were drafted by the product manager intern, leaving remarkable space for improvement.
Here is a quick glimpse of existing interfaces:
Problems Identified
After my cognitive walk-through and discussions with the team, here are listed problems and corresponding redesign goals:
Incomplete functions and information >> Complete functions & adequate information provided
Incoherent navigation logic >> Smooth and intuitive navigation path
Messy visual elements & inefficient layout >> Unified visual standards and optimised layout
Intercorrelation Analysis of Essential Elements
The design delivery needs to reflect the abstract relationship between the essential elements (project, pipeline, datasource, and run) to effectively assist asset navigation and control.
The causal, hierarchical, quantitative, and affiliation relationships between essential elements have been explored, and this process also gave me quick but in-depth understanding about this highly technical product.
After discussions within the team, we summarise the intercorrelation into a schema shown as below.
Design Delivery
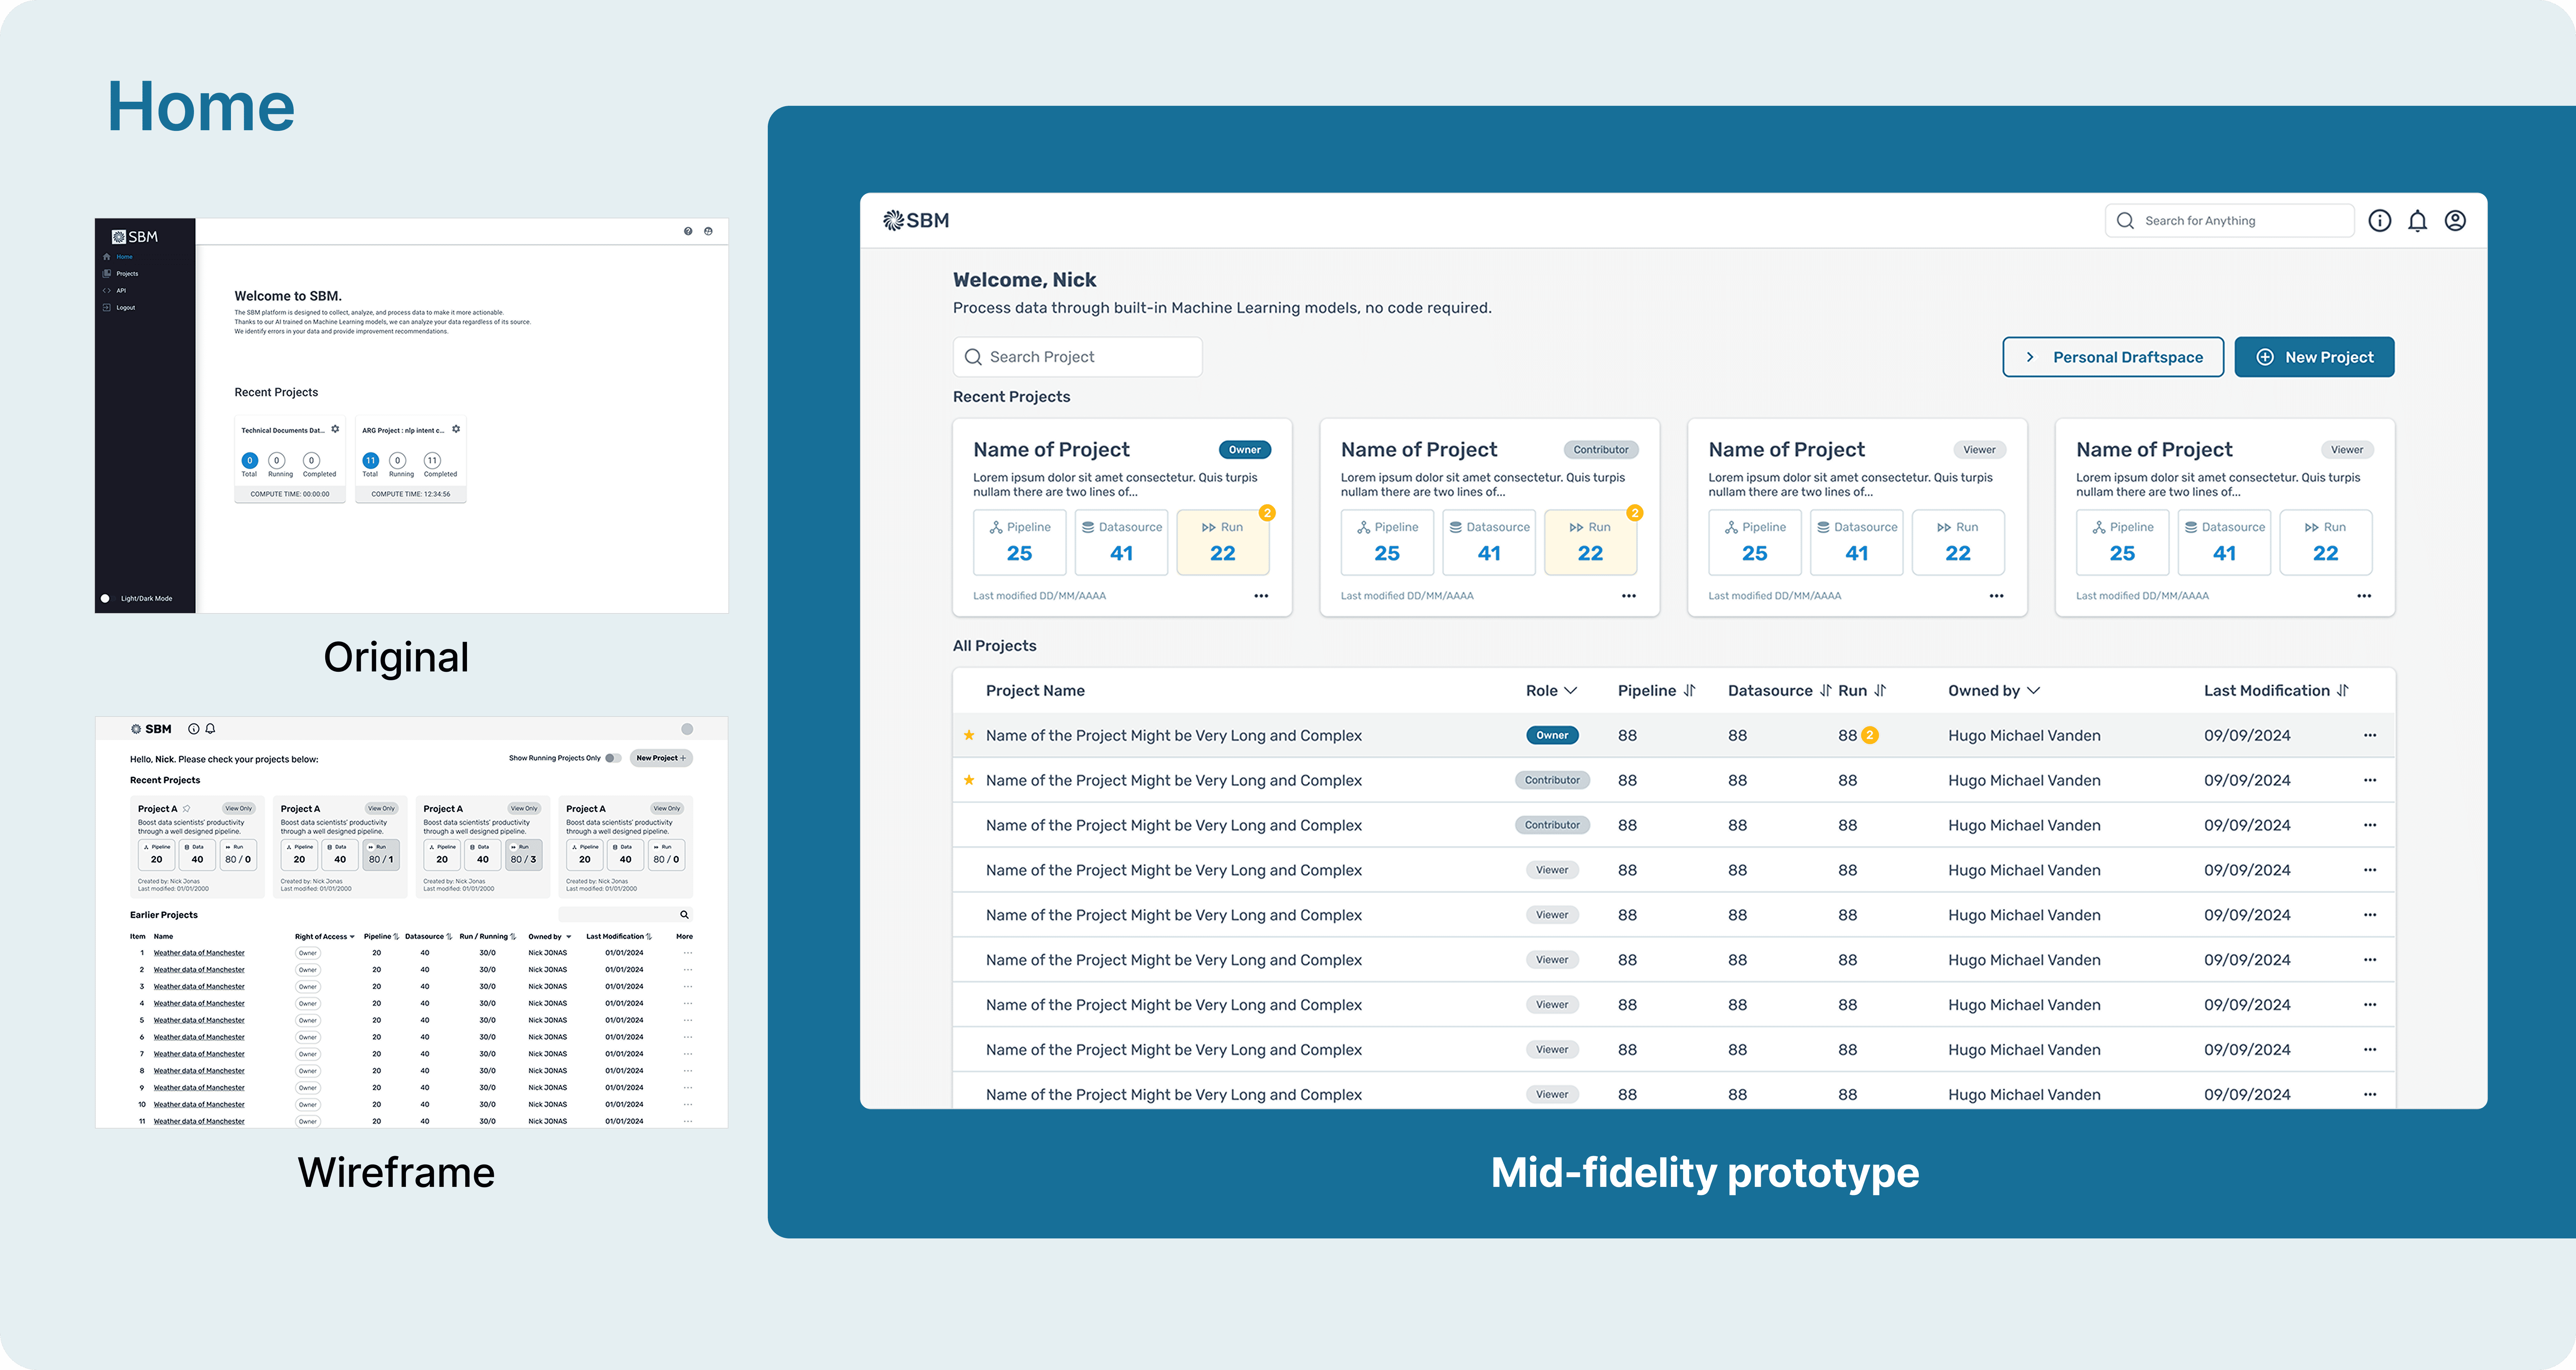
I first designed wireframes and then transformed them into coloured UIs by adopting a design system. Finally, to realise the completion of user tasks, necessary pop-ups were also delivered, marking the completion of project part 1.
To better visualise the redesign process, here is an example of 'Home' page:
Design Workshops
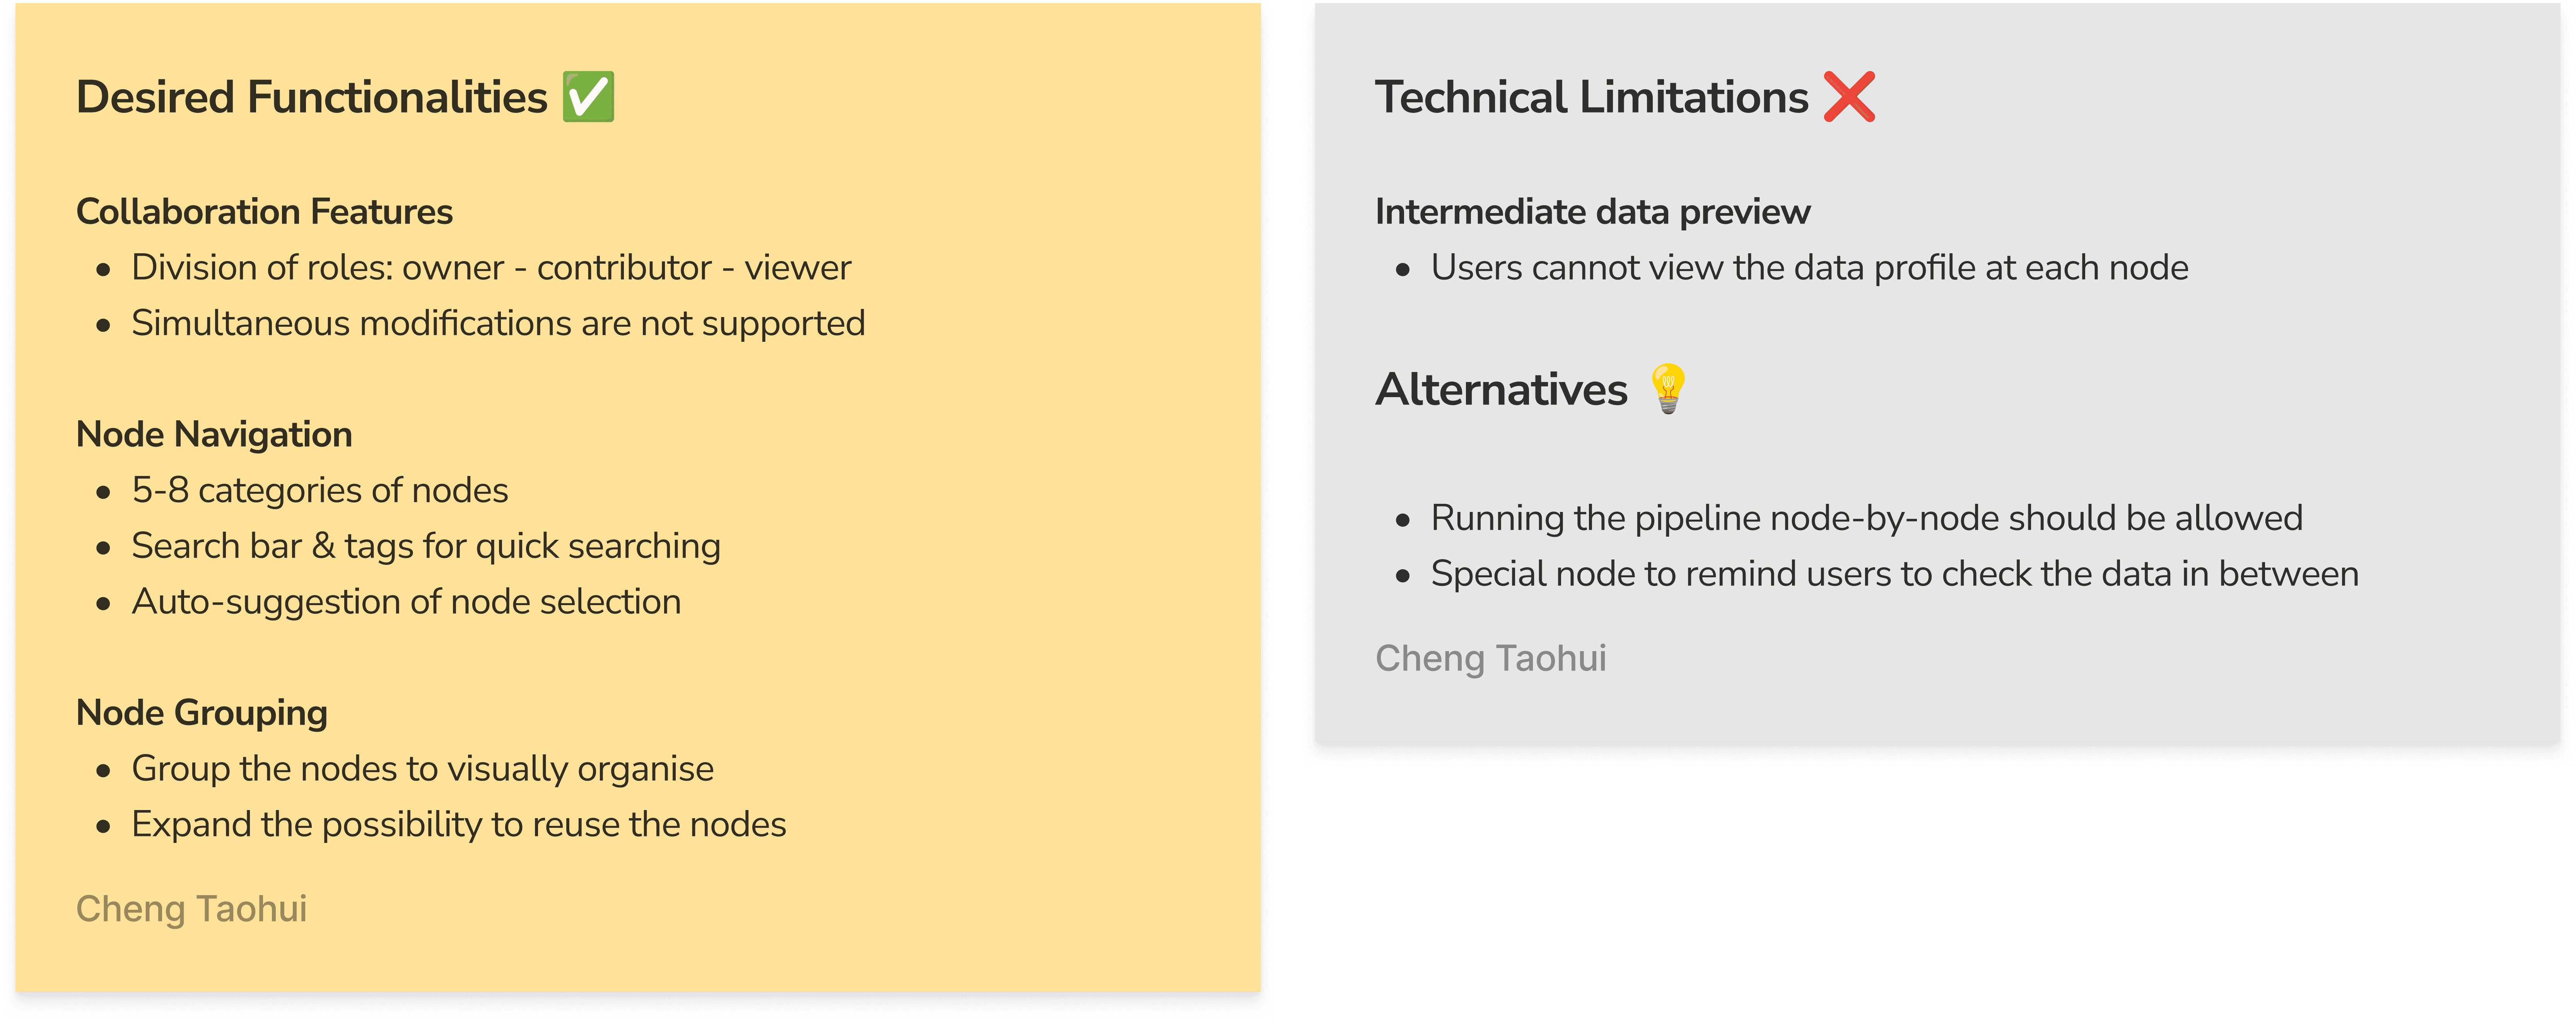
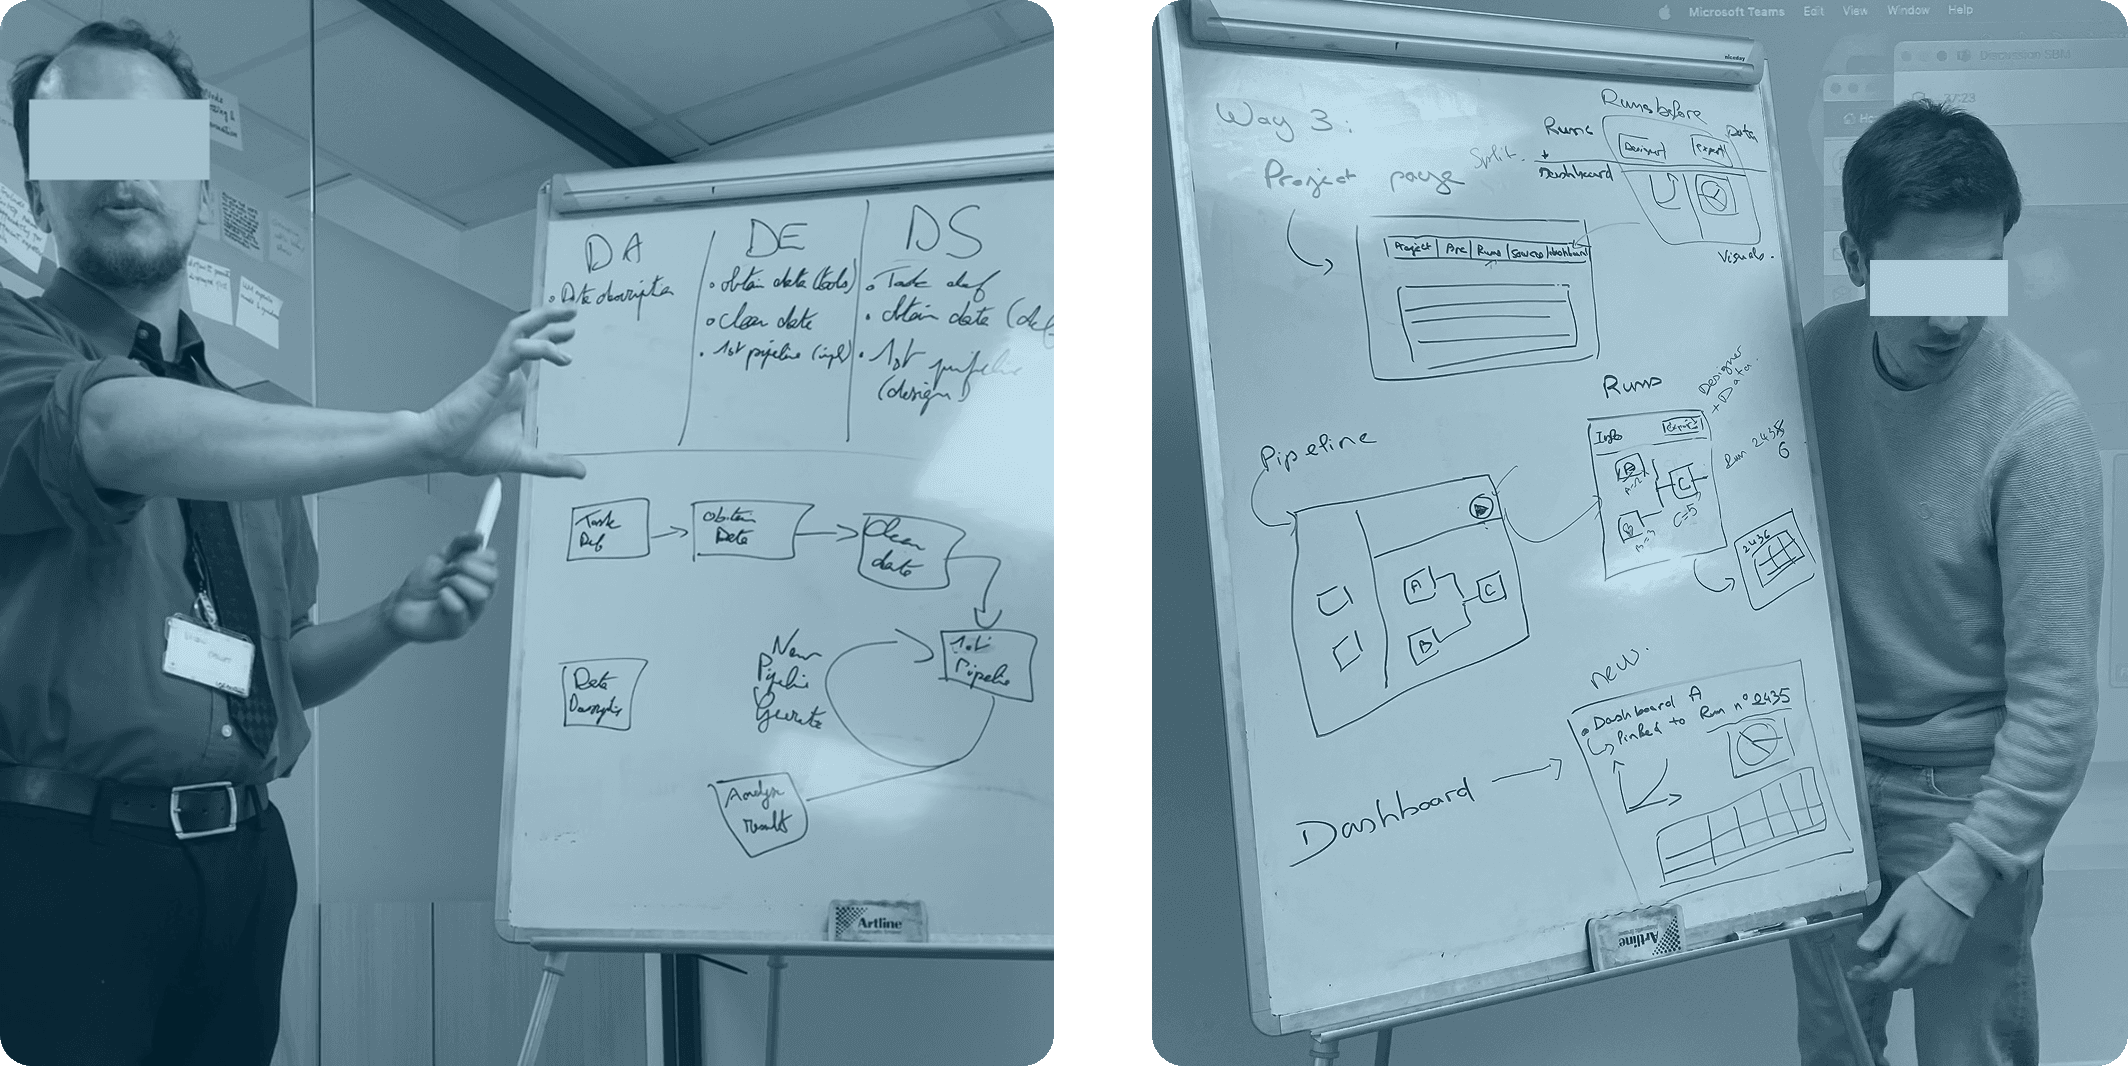
To proceed with other functions of SBM, including data pipeline designer, what would be our desired functionalities and what is our technical limitation? The workshops involved designers, product manager, data science experts, and developers.

As a result, we came up with a preliminary consensus synthesised as below:
Some tips about how I conducted workshop preparation & facilitation:
Provide a simplified user journey that is easily readable and understandable
List out assumptions and doubts in each stage and get clarified with the group
Organise brainstorming first before discussing on details
Remember to allocate dedicated time for the introverted ones to speak
Take notes on both the agreed aspects and controversial ones, in case further research might be needed afterwards
Part 2 - Facilitating Collaborations in Data Pipeline Design
Design Research and Analysis
Desk Research
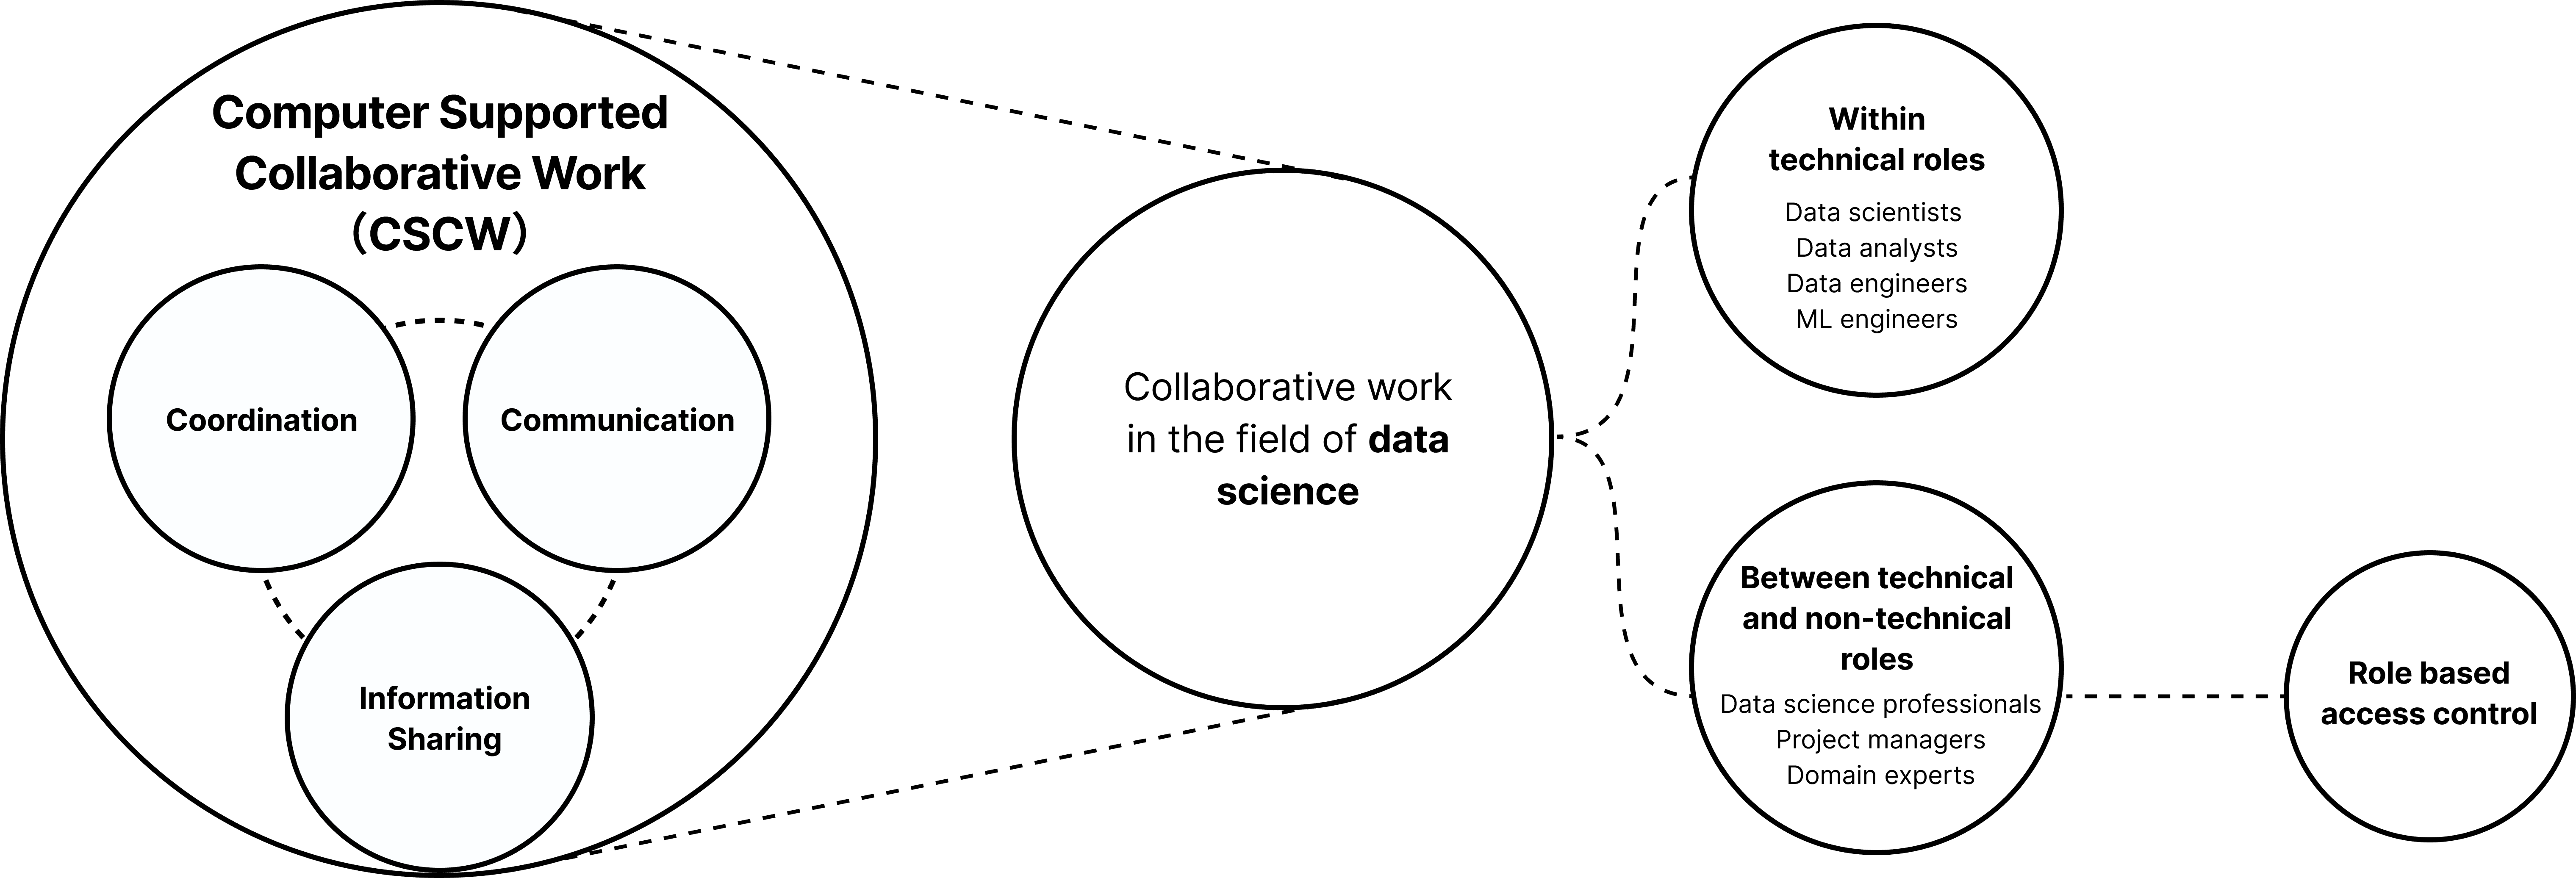
The desk research composes two perspectives - user and product. In essence, it's mainly about who uses this product and how this category of product is built.
From user's perspective, I investigated how various roles in a data science project differ from each other, what is their collaboration mode, and the workplace mechanics between them.
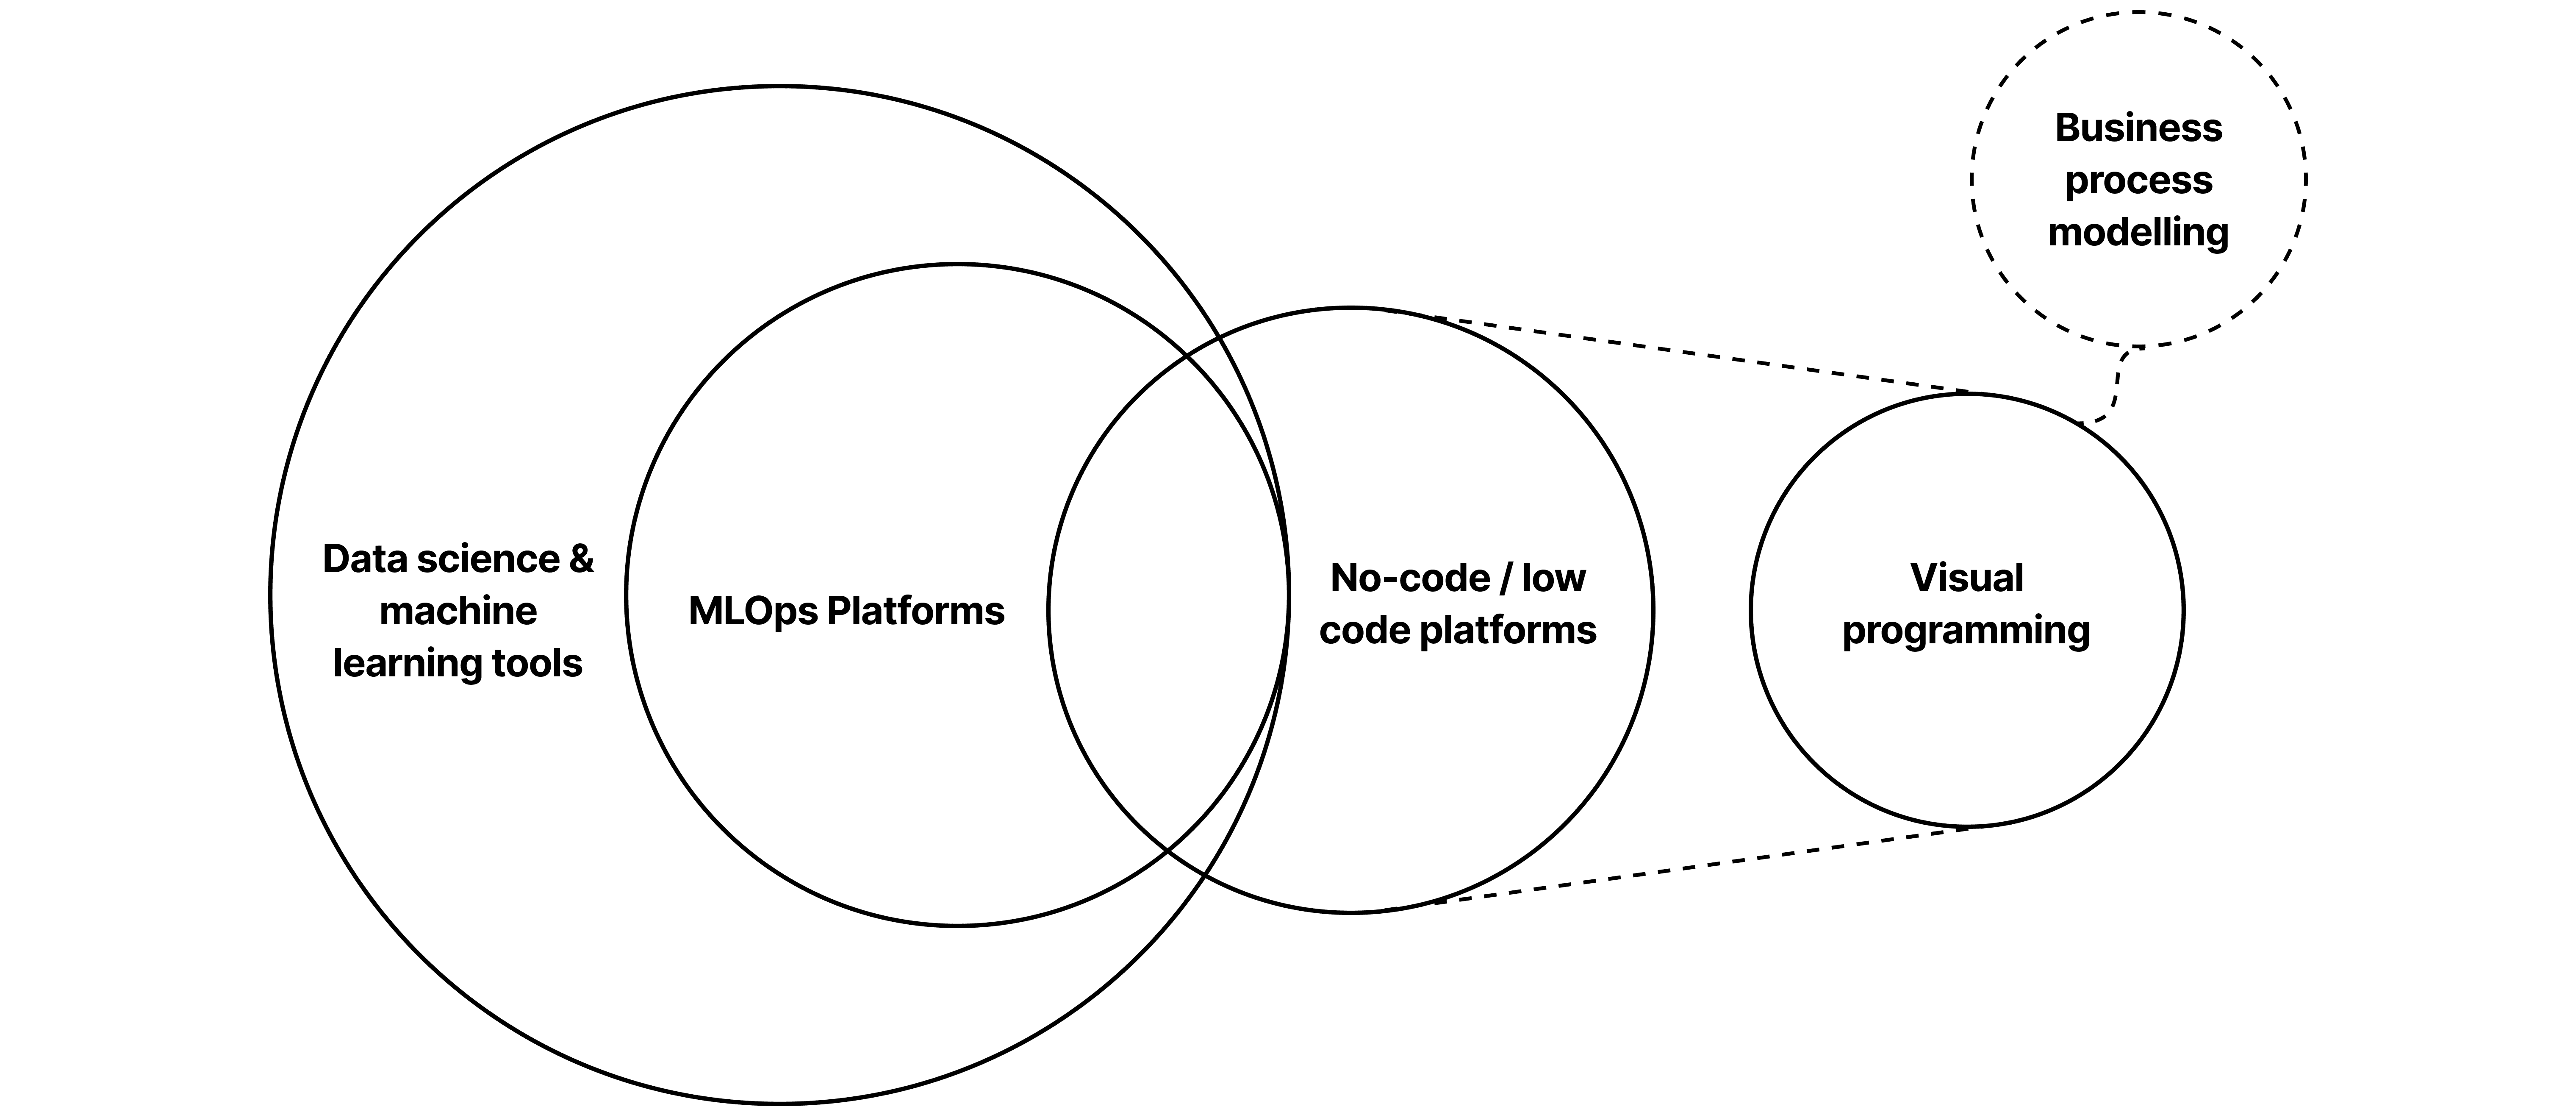
From the perspective of product, I dived through the transformation of MLOps software: its transformation, cognitive principles, and design guidelines.
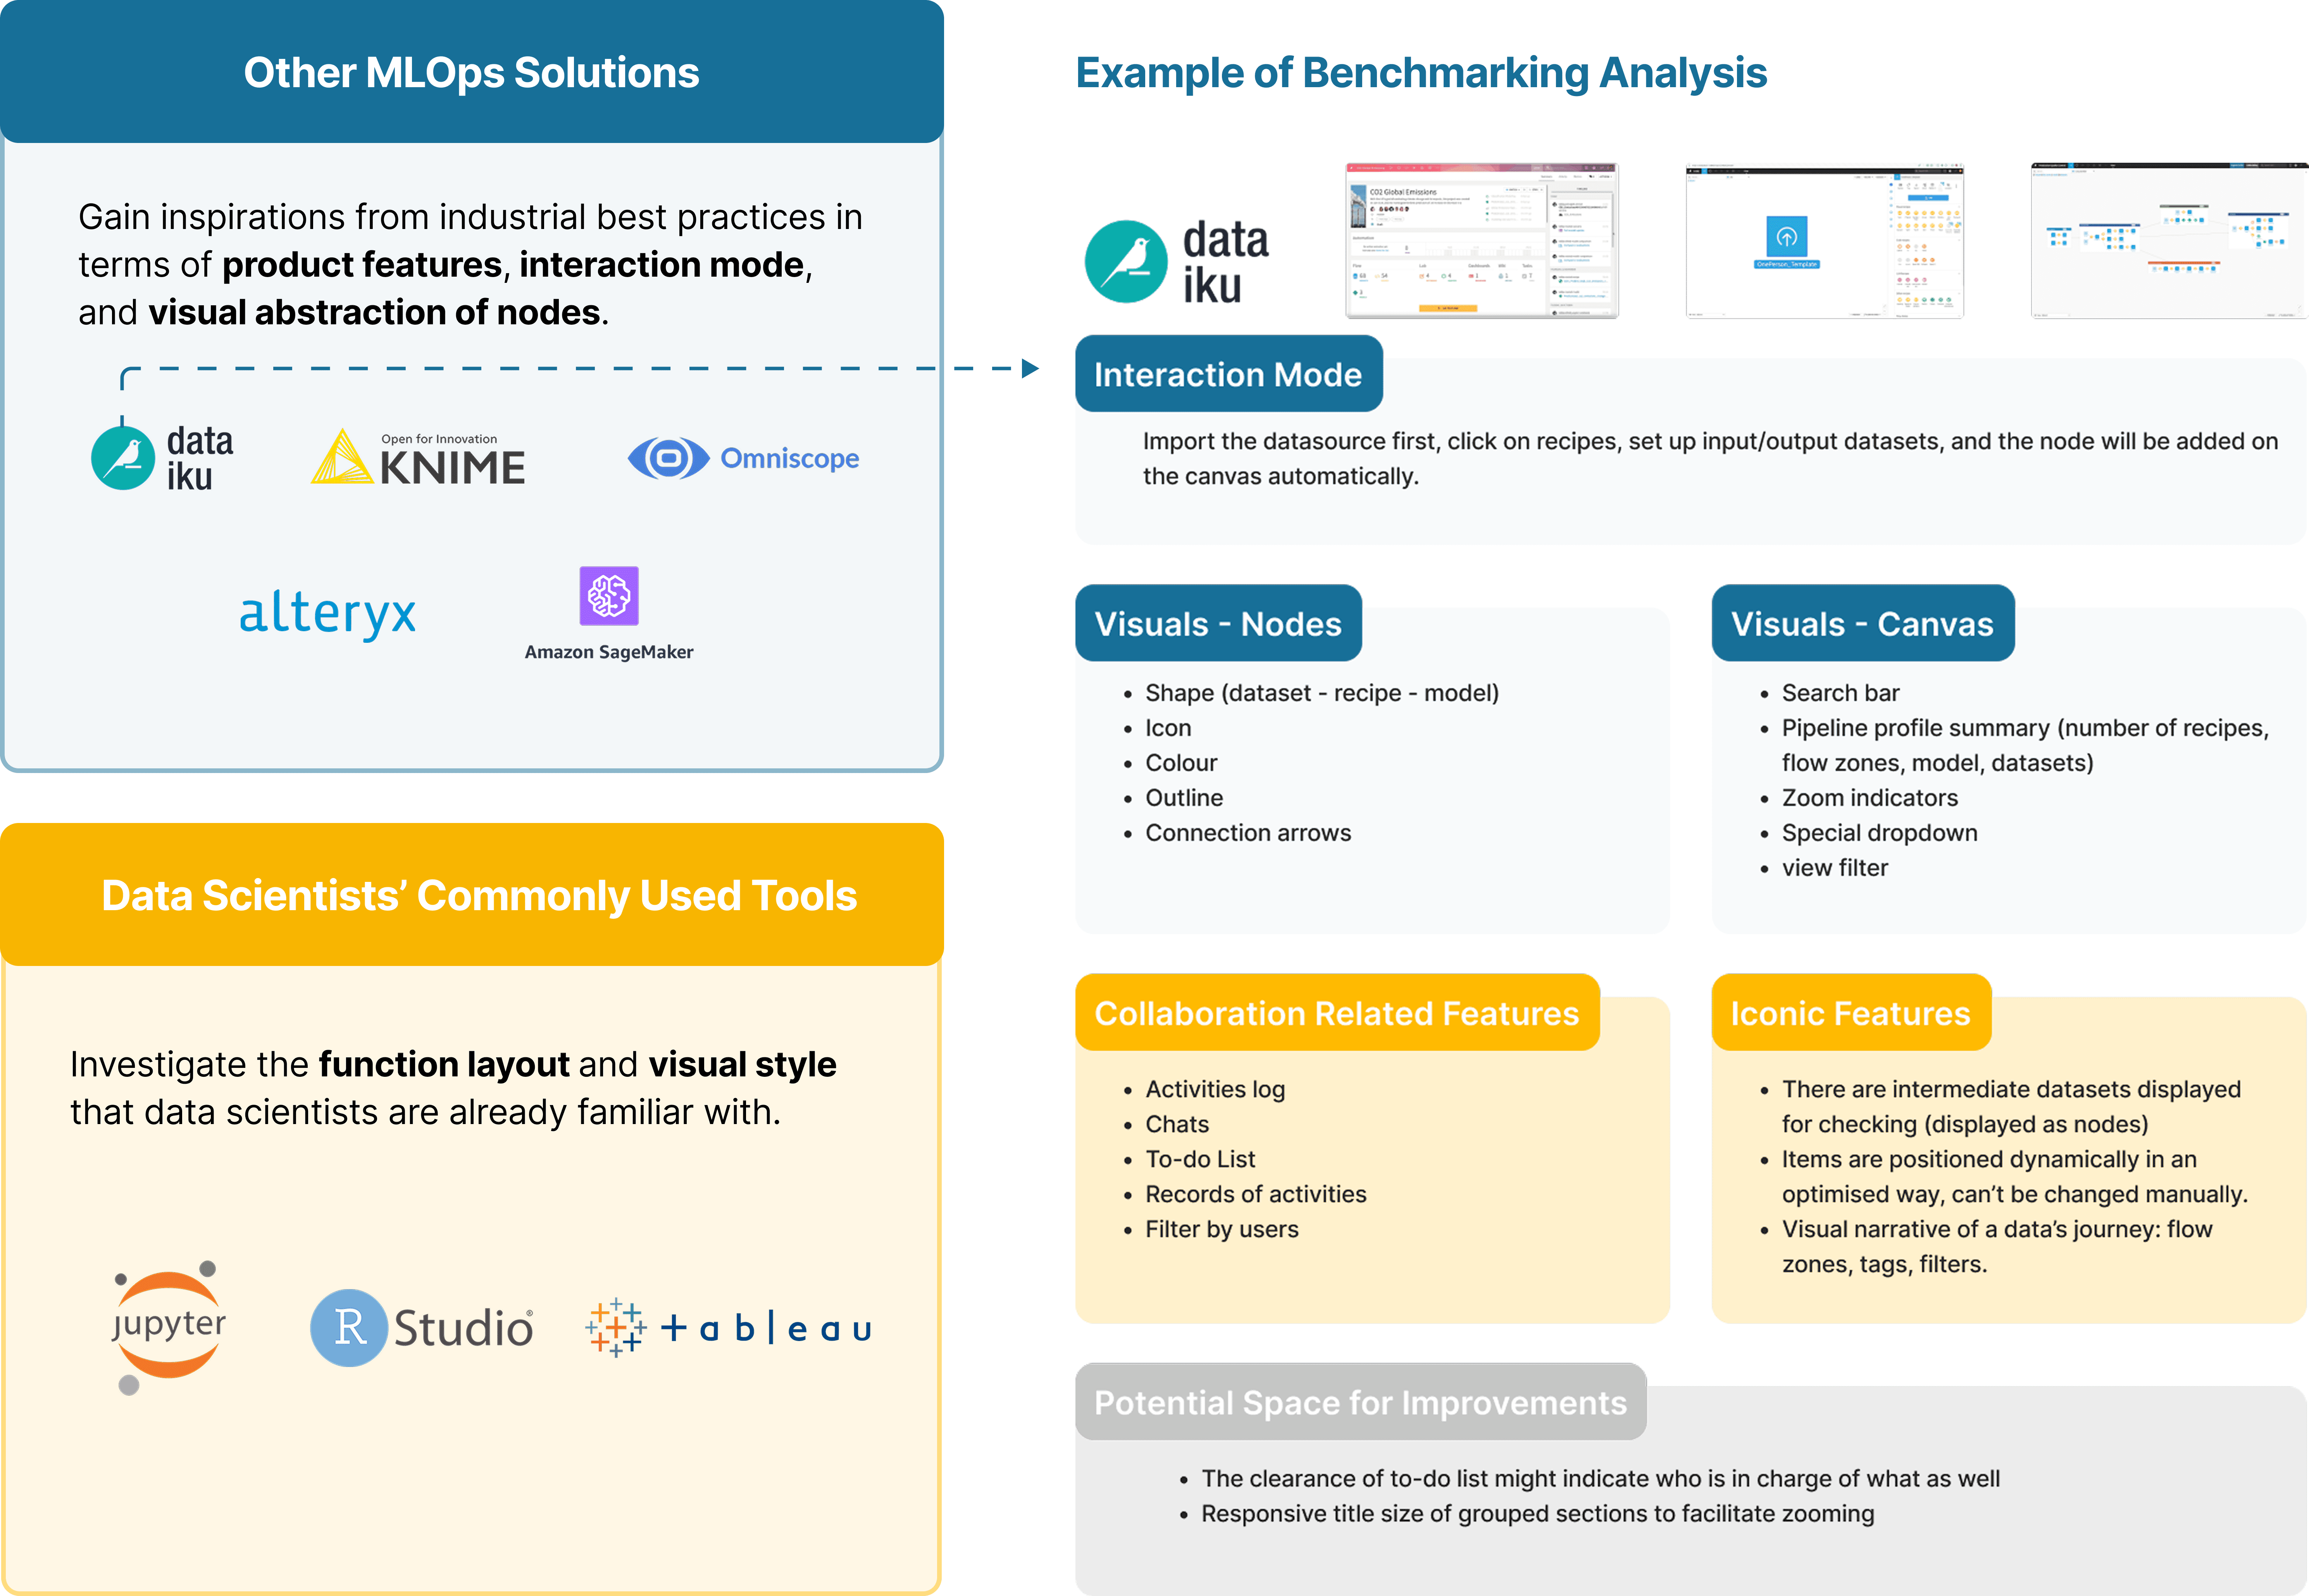
Benchmarking
I also learned from both industrial best practices of MLOps tools as well as users' current commonly used tools to learn about the current product ecosystem and user's familiar design patterns.
Expert Interview
I also conducted 3 rounds of expert interview, which allowed them to:
Share personal collaboration experiences
Provide feedback of using existing MLOps platforms
Validate the assumptions I made from previous research
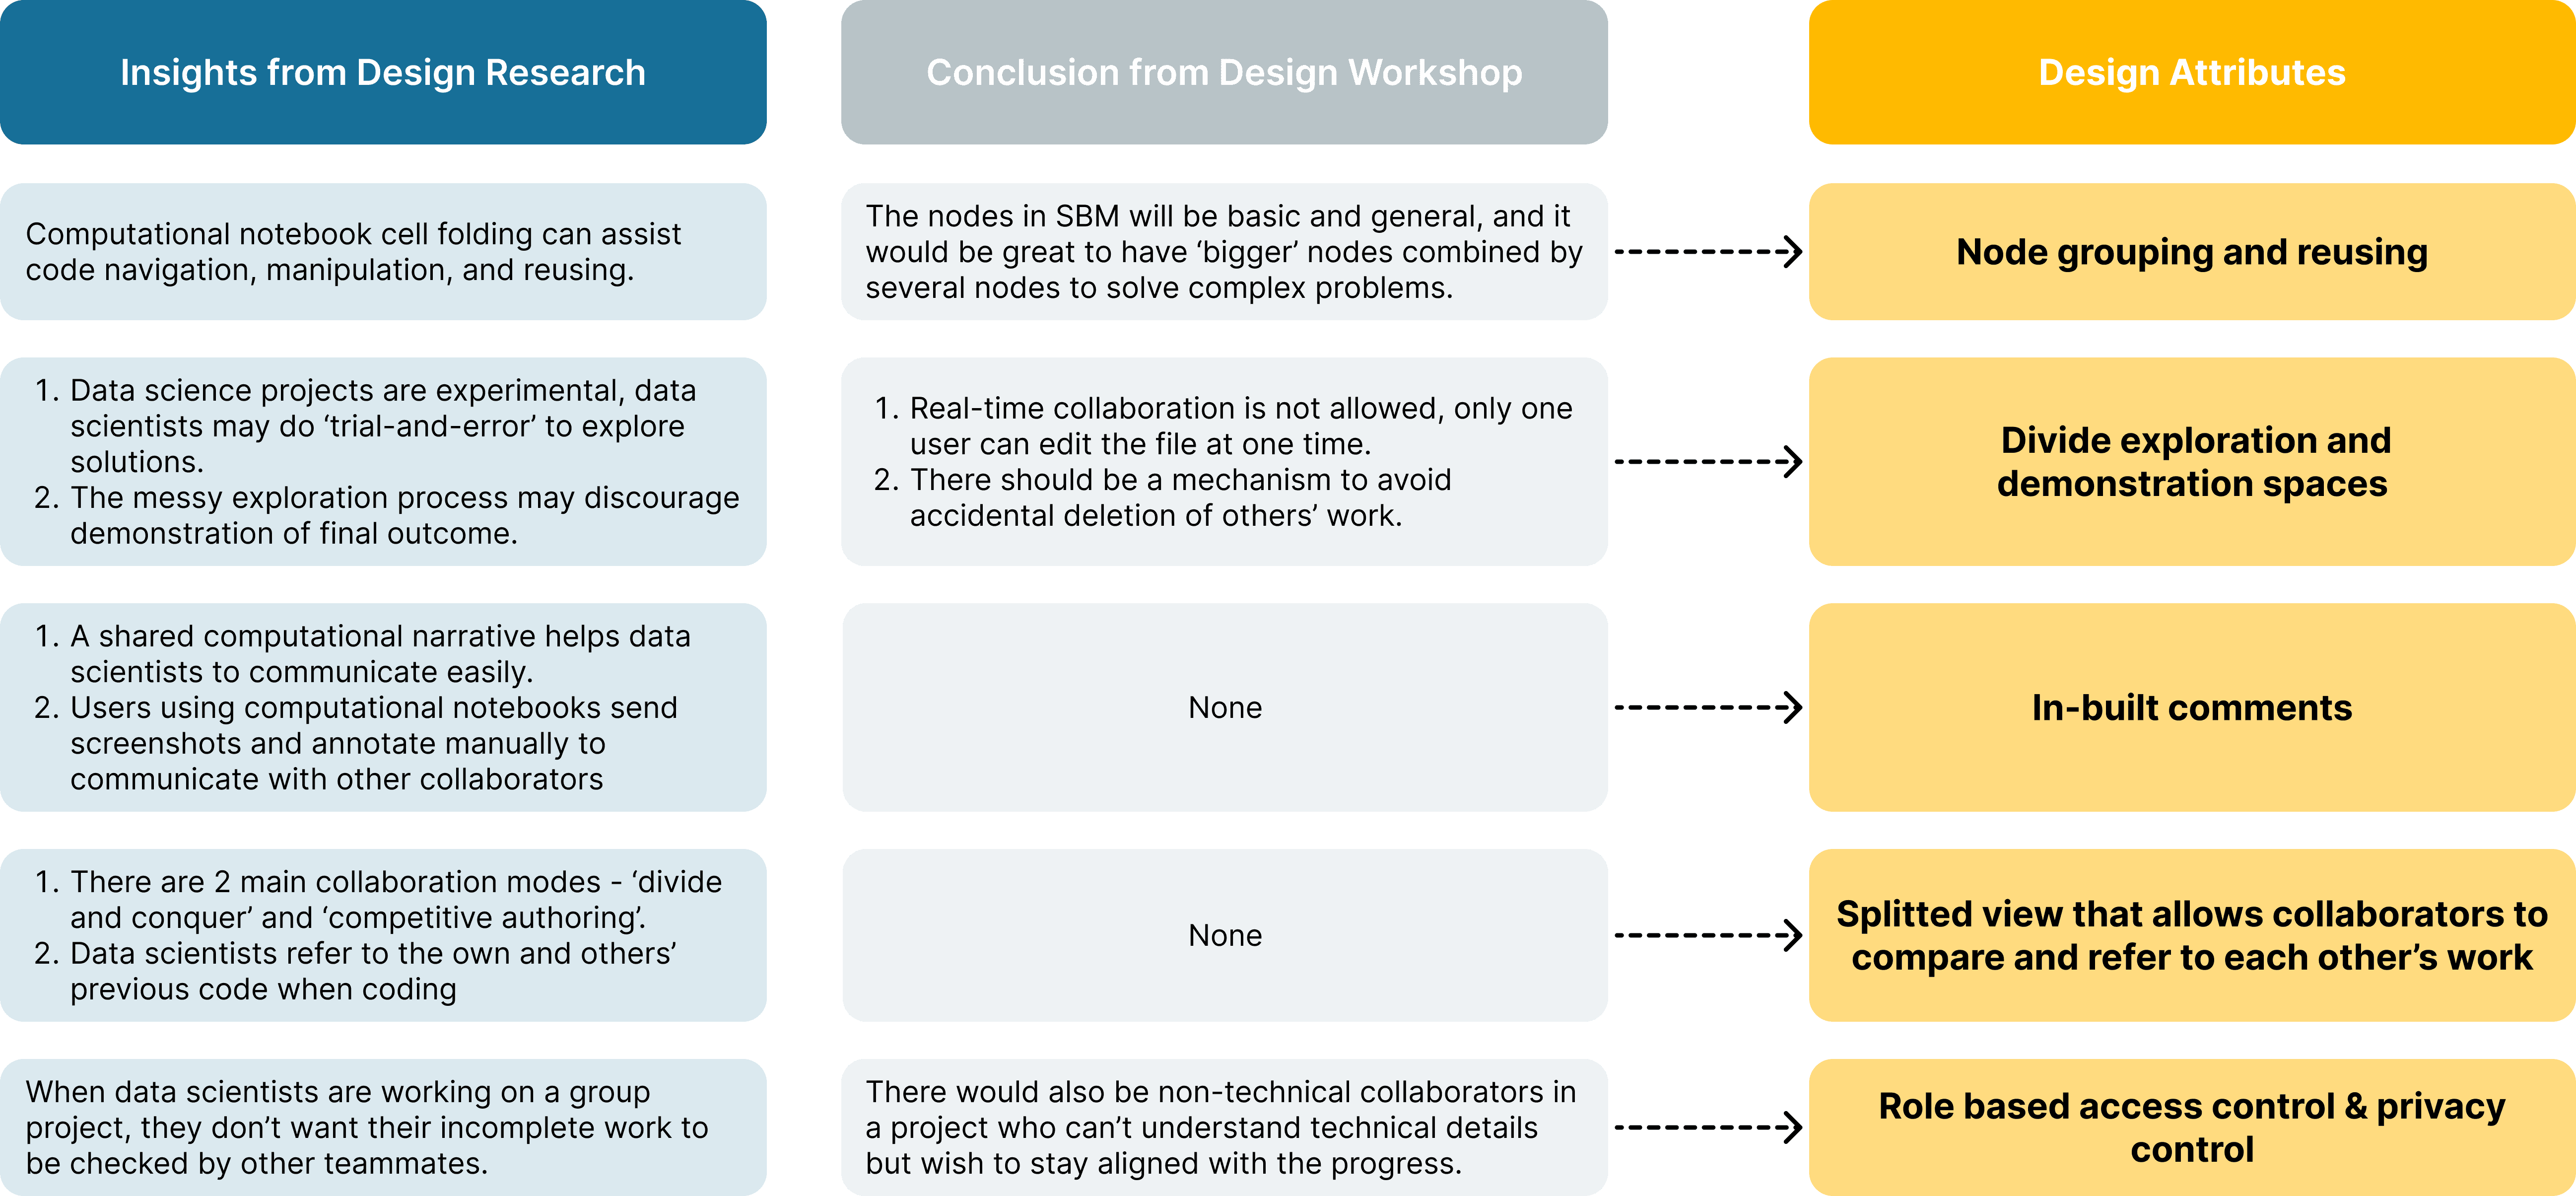
From Research Discovery to Design Opportunities
With a synthesised analysis of information collected from both first hand / second hand research and the workshops with my team, I summarised 5 main design attributes.
Some of them are not identified in the workshop but displays potential value from desk research.
Design Iterations
From iteration 1 to 2, there has been increased level of feature completion and interface fidelity, while iteration 3 focuses on a supplementary feature on top of iteration 2, so it is delivered and evaluated quickly.
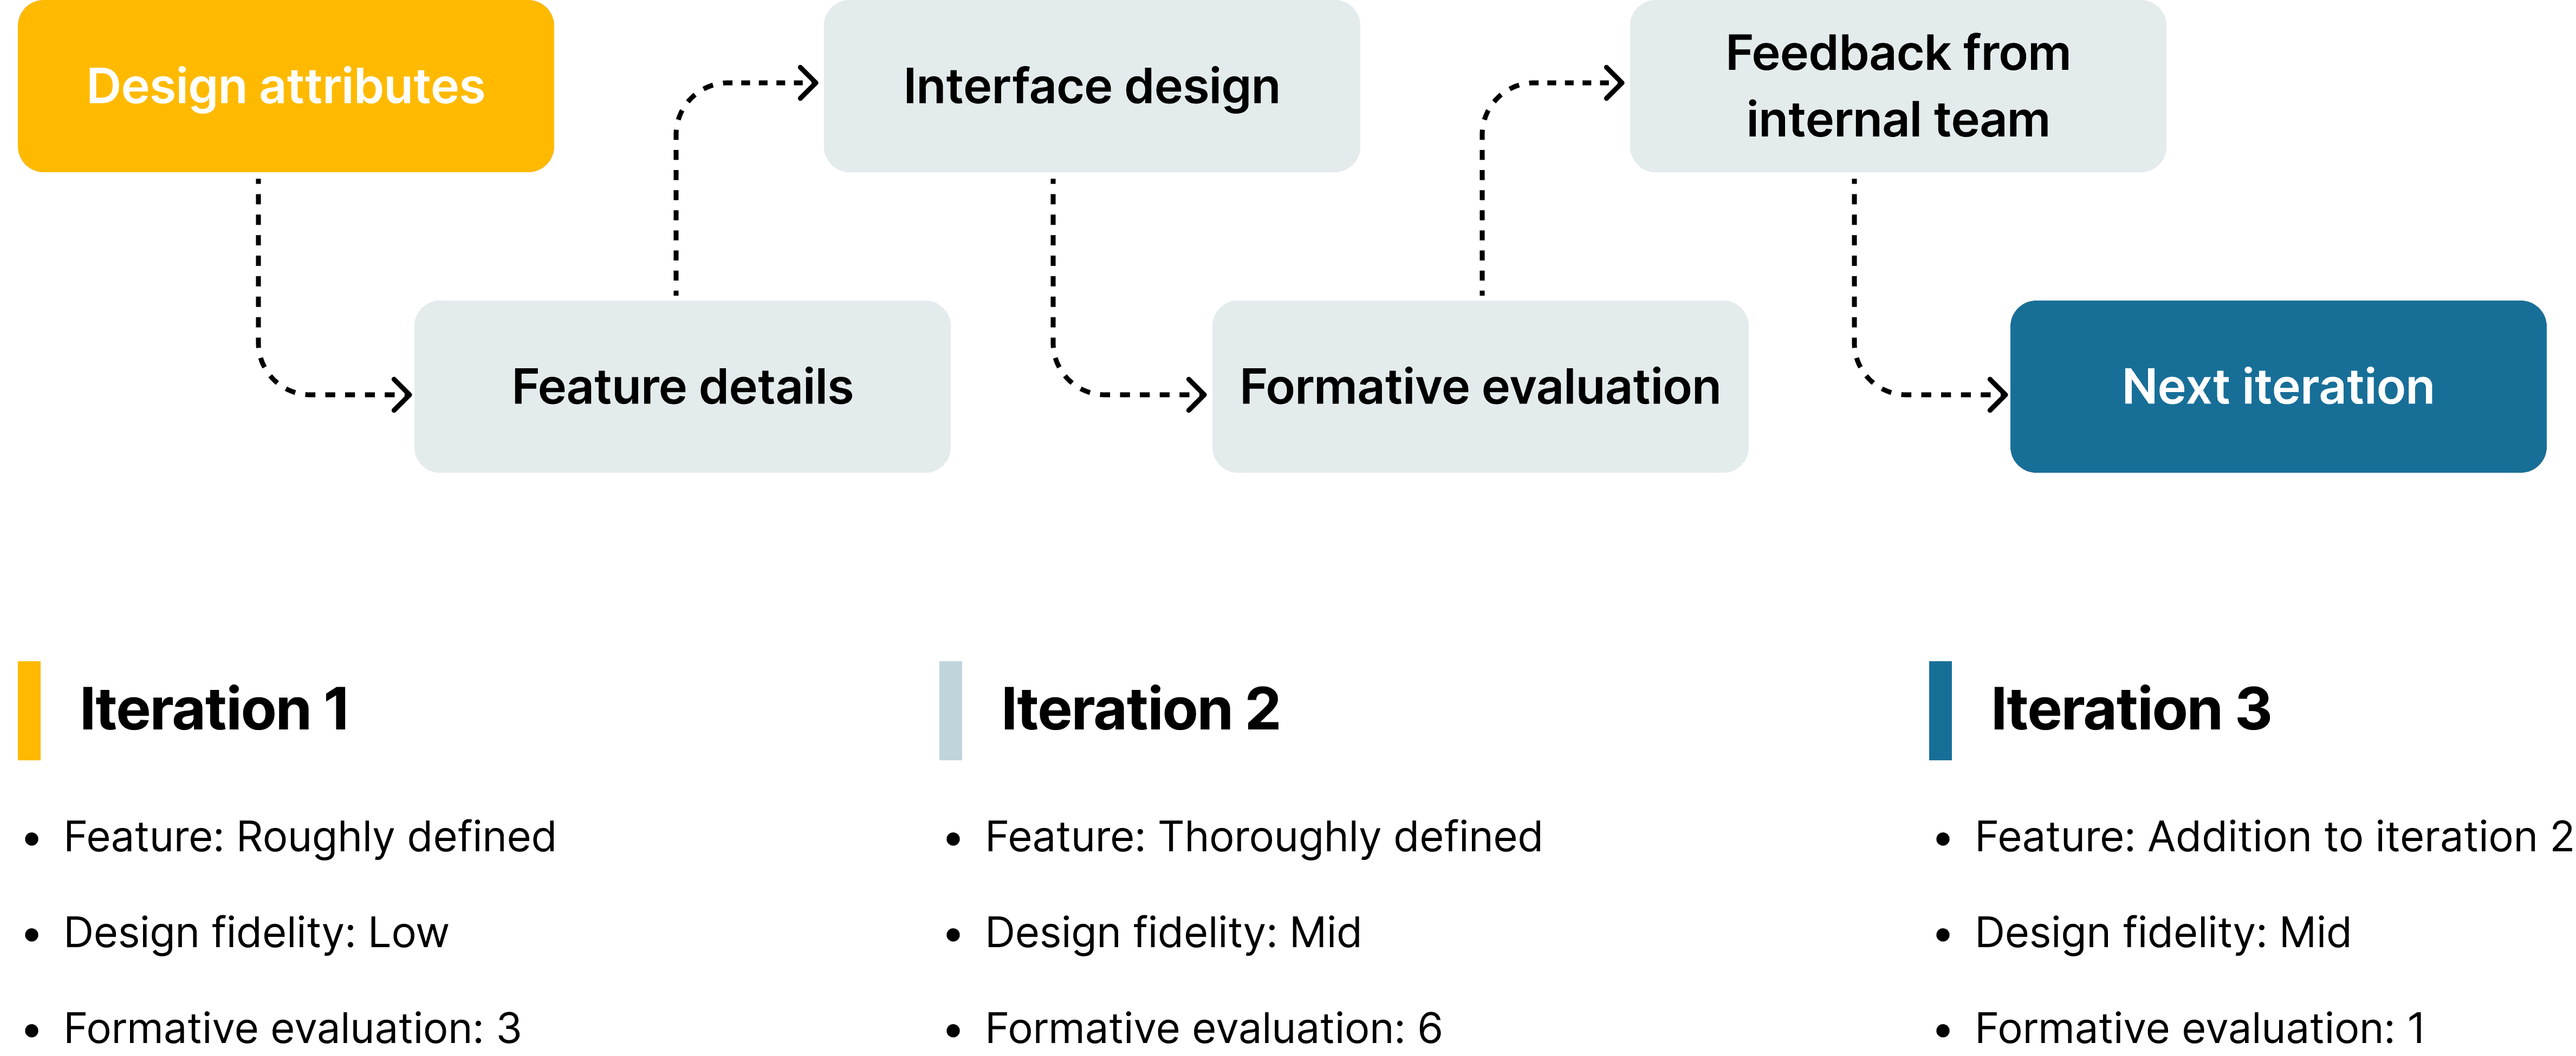
Formative evaluation is my major approach of feature value validation, which I walked through all design interfaces with target users with detailed explanation, and collected constructive feedback from them.
Final Design Delivery
1 - Pipeline Designer Side Panels
Side panel tabs are in correspondence with the project hub. It's dynamic, organised, and simplistic.
2 - Node Grouping and Metanode
The grouped 'node section' can be published with as a reusable asset 'metanode' with selection of visibility range and pre-assigned settings.
(The canvas dragging action can't be simulated in the prototype so only the outcome is displayed)
3 - In-Built Comments
Users are allowed to comment in 3 levels of granularity - node, node section, and entire pipeline. Comment history can also be checked from the comment thread.
4 - Normal pipeline, integration pipeline, and personal draftspace
Normal pipeline is for data science team's internal experimentation, integration pipeline is for final delivery & stakeholder communication, personal draftspace for user's individual practice.
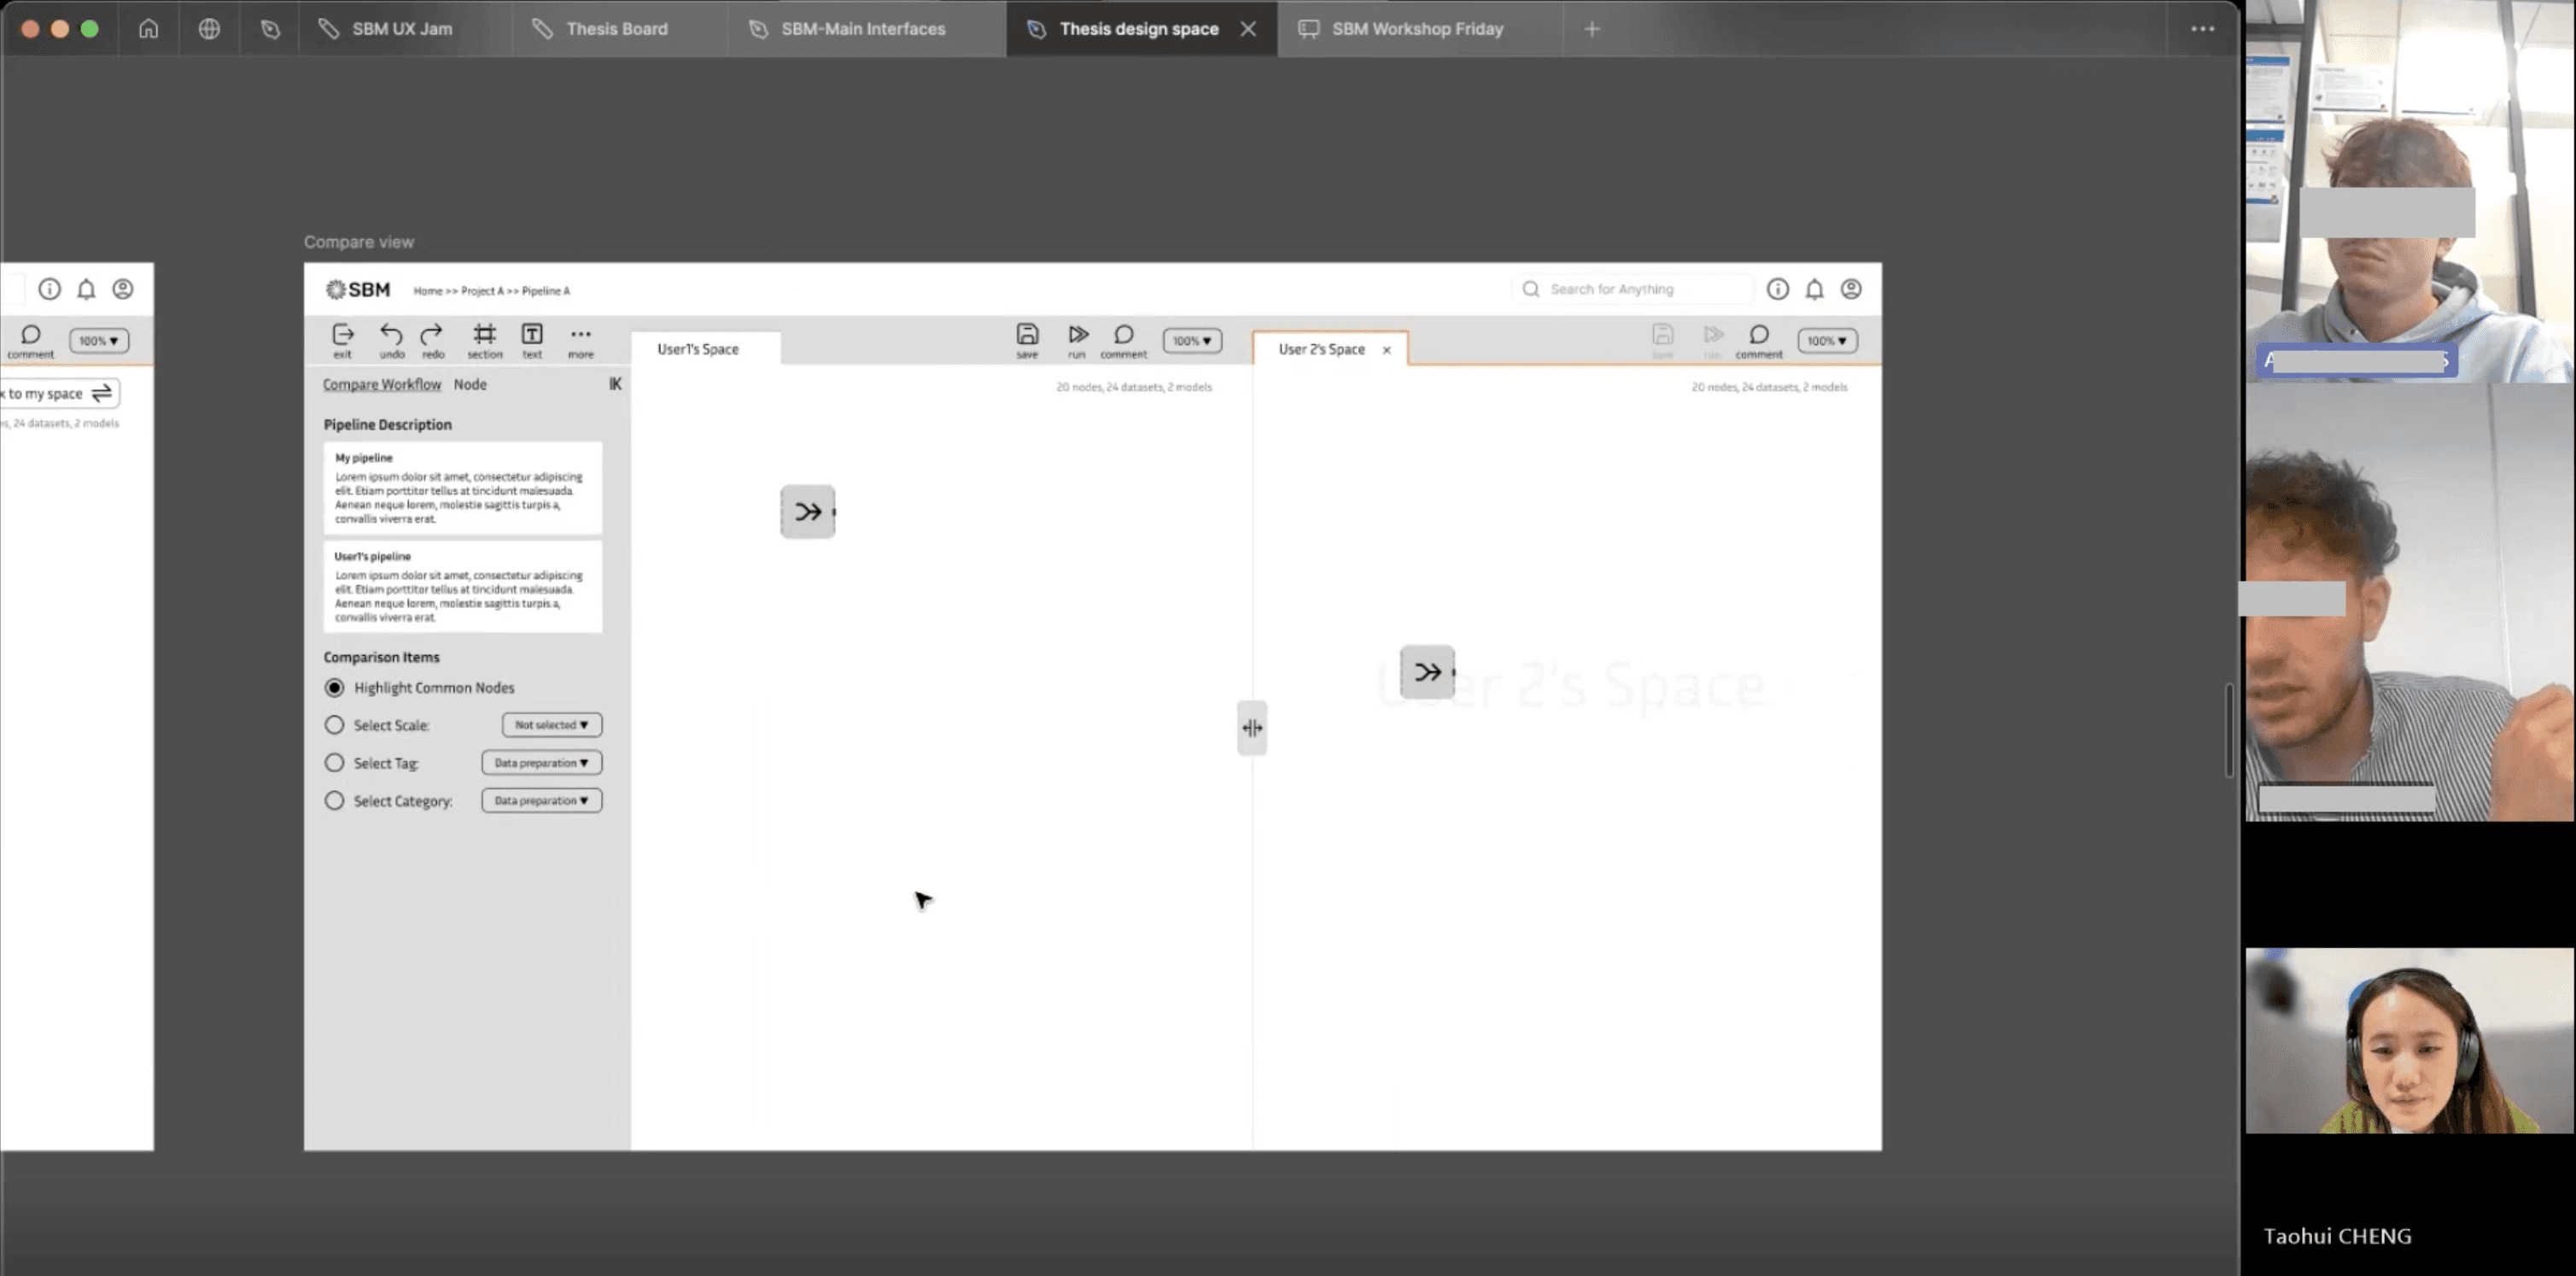
5 - Compare View and ML Performance Evaluation Metrics
Users can compare the current pipeline with another one and compare ML performance through a detailed evaluation report.
Usability Testing
With the validation of feature value, finally I also tested the usability of the design, to check whether everything is considered easy to use and visually pleasing.
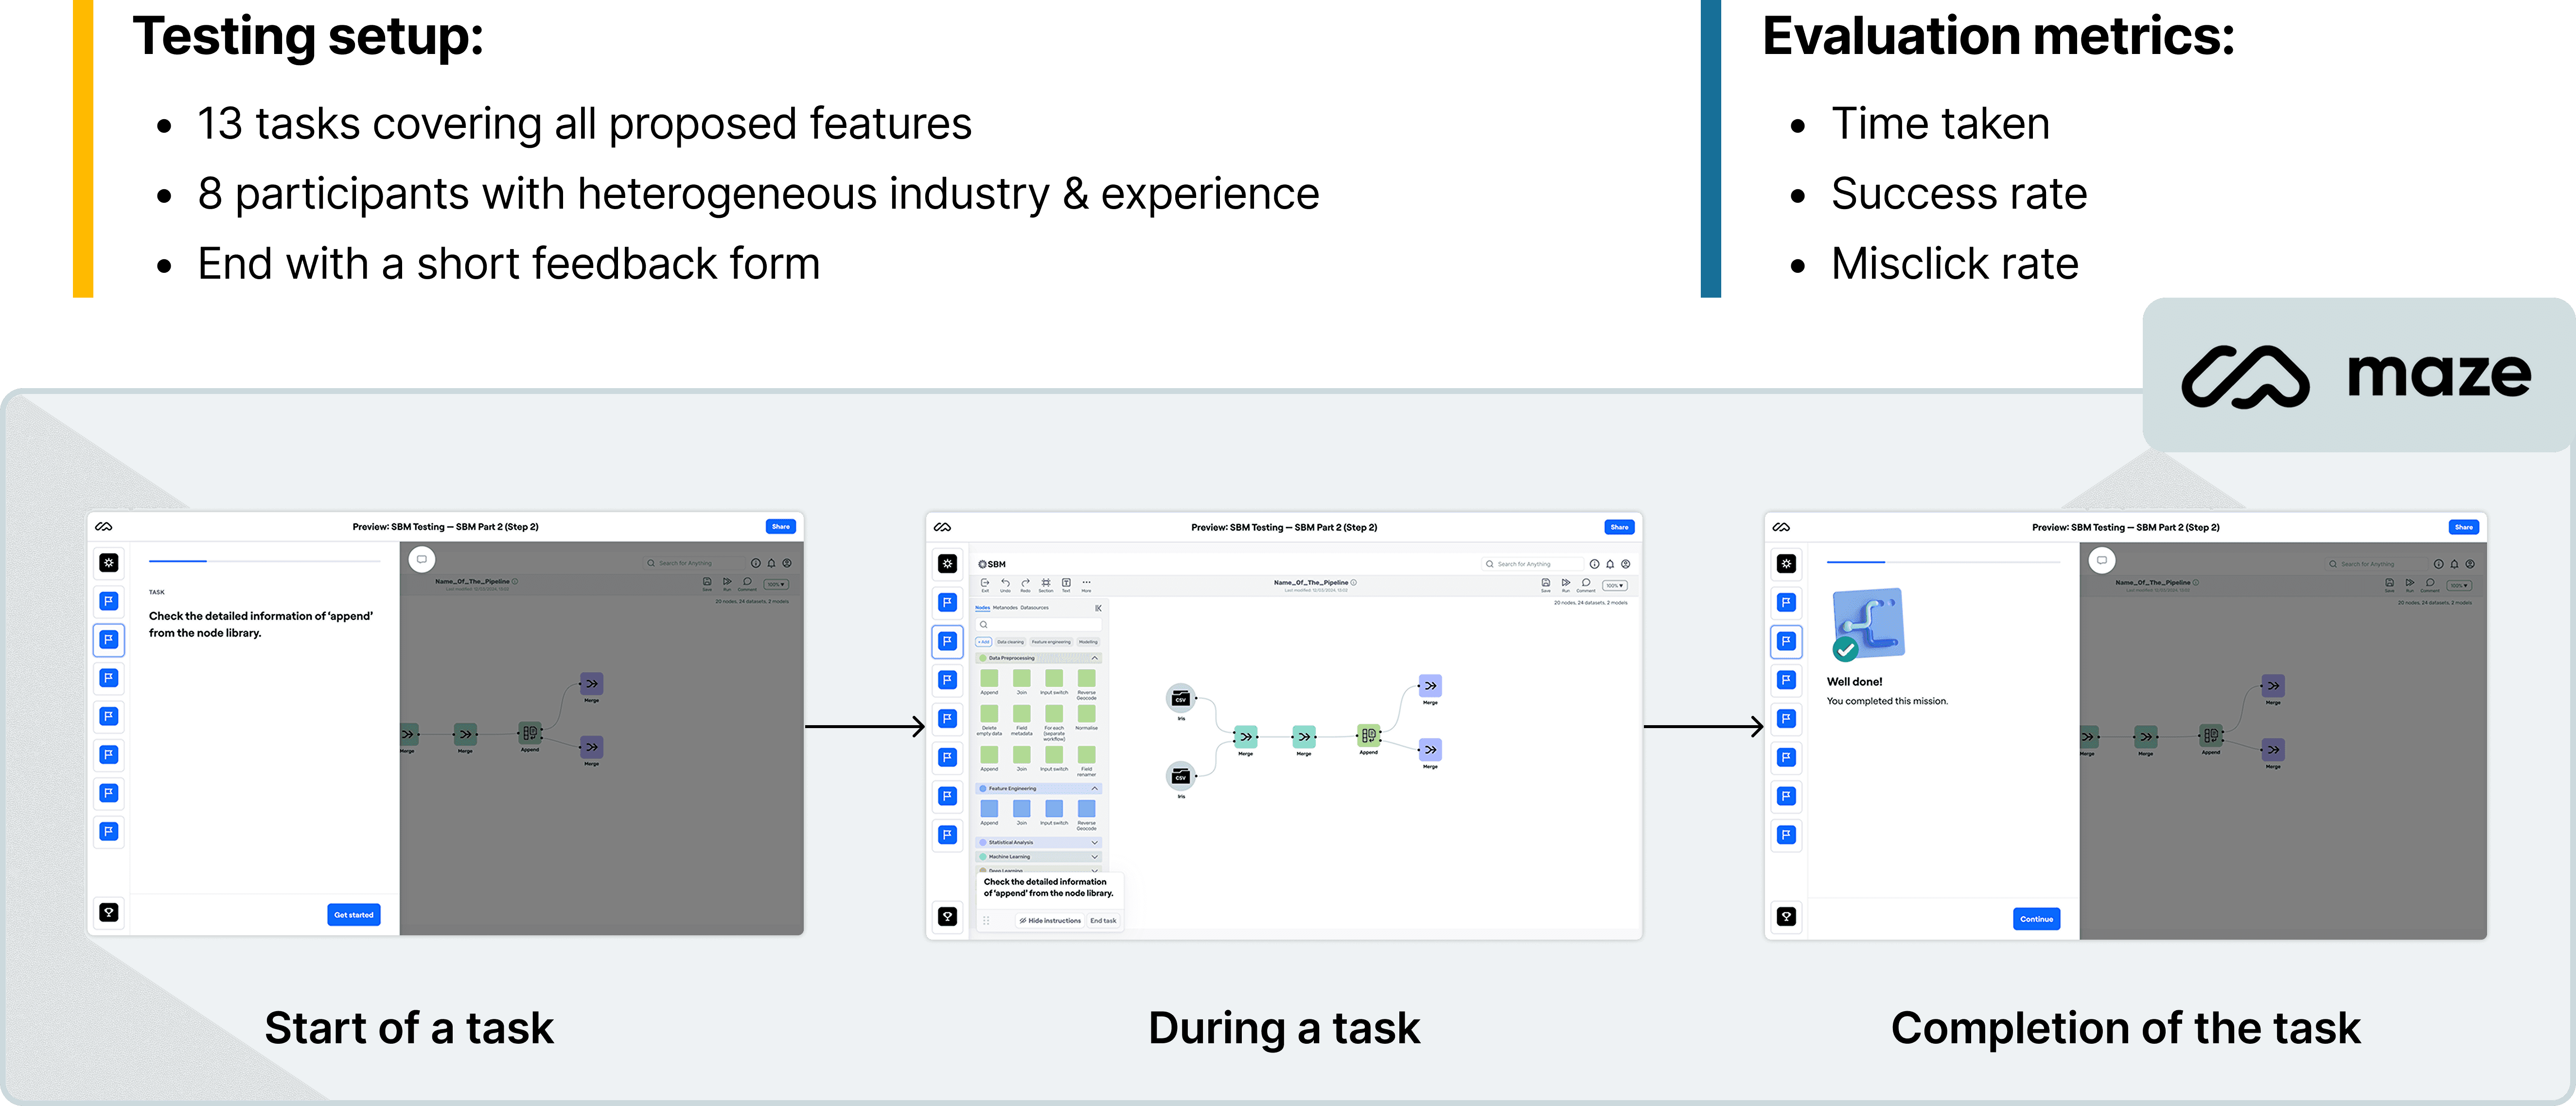
Implications
Satisfactory visuals & usability: With average rating of 8.1 and 7.8 (out of 10) respectively
Effectiveness of pre-training: Previous knowledge about what is SBM & how to use it significantly improve task success rate
Space for Improvement: Certain functions are hard to find, so the navigation path can be further improved
Reflections
Problems Encountered & How I Solved:
Absence of Mentor & Non-responding Professor: My situation in this internship has been unique. My mentor was in sick leave since my day 1 of internship and my thesis instructor was always too busy to respond me. I had no prior experience working in such highly technical project so there were plenty of things I need to learn.
Lack of UX Maturity within the Company: I was actually the first designer recruited in the team, and the engineers have no prior experience collaborating with a designer. In a long time, they thought I just make beautiful visuals. In this sense, I always need to share my thoughts and my direction to help them get aligned.
Key Learnings:
Innovate through Scientific Research: I found it hard to imagine the workflow of data scientists and how they collaborate within a team. I managed to gain deep understanding about their behaviour and pain points through reading academic research papers, leading to constructive proposed solutions.
Thrive with Proactivity: My leader and teammates had no idea what was my role and what I needed. I displayed proactivity to always share my ideas, ask them questions, and organise meetings with them.
Workshop Facilitation: It was my first time organising workshop for multiple roles. I discovered the effectiveness to always prepare simplistic and visual materials as the baseline of discussion.
Next Step:
Explore the Inclusion of AutoML functionality: AutoML functionality is also an agreed vision of our product, which we have existing resource to develop and implement.
Expand the version control functionality: Version control is considered essential for error recovery and conflict resolution in teamwork, while I had no time to delve deeper during these 6 months.
🧑💻 Summary:
SBM, short for ‘Smart Behaviour Management’, is a project in Alten Lab Sophia Antipolis, it aims for creating a node-based programming tool for data science teams to build data pipeline and machine learning models in an easier way.
I worked as the project design lead while the final outcome is also my master research thesis. During these 6 months working with developers and data science experts, I redesigned all existing interfaces first, and then conducted an in-depth research focused on the collaboration between technical roles in the aspects of coordination, communication, and information sharing, which turned into 5+ newly initiated features beyond currently existing products in the industry.
As a result, testing sessions with target users largely validated the value of all of my proposed initiatives, and my design deliveries would be developed by engineers. (I also graduated with a score of 110/110)
P.S: If you are interested in my full thesis in pdf format, check it out from the button at the left : )
Process Overview
Context
About Alten Labs:
Alten is a french multinational consultancy company in technology and engineering, it has a department 'Alten Labs' mainly work as an incubation centre for creating innovative solutions for the company.
About the project SBM:
SBM, short for ‘Smart Behaviour Management’ is a tool based no-code digital platform (desktop) for data science teams who spend a long time on coding data pipelines to automate their workflow through connecting modular data processing algorithm components.
In the industry, this kind of tool also has a name called ‘MLOps platforms’. Some popular products are AzureML, Dataiku, KNIME, etc…
Part 1 - Primary Interface Redesign
When I joined the project, there was already a proof of value (POV) version of primary interfaces, which list out user's data science projects as well as necessary assets within them. The interfaces were drafted by the product manager intern, leaving remarkable space for improvement.
Here is a quick glimpse of existing interfaces:
Problems Identified
After my cognitive walk-through and discussions with the team, here are listed problems and corresponding redesign goals:
Incomplete functions and information >> Complete functions & adequate information provided
Incoherent navigation logic >> Smooth and intuitive navigation path
Messy visual elements & inefficient layout >> Unified visual standards and optimised layout
Intercorrelation Analysis of Essential Elements
The design delivery needs to reflect the abstract relationship between the essential elements (project, pipeline, datasource, and run) to effectively assist asset navigation and control.
The causal, hierarchical, quantitative, and affiliation relationships between essential elements have been explored, and this process also gave me quick but in-depth understanding about this highly technical product.
After discussions within the team, we summarise the intercorrelation into a schema shown as below.
Design Delivery
I first designed wireframes and then transformed them into coloured UIs by adopting a design system. Finally, to realise the completion of user tasks, necessary pop-ups were also delivered, marking the completion of project part 1.
To better visualise the redesign process, here is an example of 'Home' page:
Design Workshops
To proceed with other functions of SBM, including data pipeline designer, what would be our desired functionalities and what is our technical limitation? The workshops involved designers, product manager, data science experts, and developers.
As a result, we came up with a preliminary consensus synthesised as below:
Some tips about how I conducted workshop preparation & facilitation:
Provide a simplified user journey that is easily readable and understandable
List out assumptions and doubts in each stage and get clarified with the group
Organise brainstorming first before discussing on details
Remember to allocate dedicated time for the introverted ones to speak
Take notes on both the agreed aspects and controversial ones, in case further research might be needed afterwards
Part 2 - Facilitating Collaborations in Data Pipeline Design
Design Research and Analysis
Desk Research
The desk research composes two perspectives - user and product. In essence, it's mainly about who uses this product and how this category of product is built.
From user's perspective, I investigated how various roles in a data science project differ from each other, what is their collaboration mode, and the workplace mechanics between them.
From the perspective of product, I dived through the transformation of MLOps software: its transformation, cognitive principles, and design guidelines.
Benchmarking
I also learned from both industrial best practices of MLOps tools as well as users' current commonly used tools to learn about the current product ecosystem and user's familiar design patterns.
Expert Interview
I also conducted 3 rounds of expert interview, which allowed them to:
Share personal collaboration experiences
Provide feedback of using existing MLOps platforms
Validate the assumptions I made from previous research
From Research Discovery to Design Opportunities
With a synthesised analysis of information collected from both first hand / second hand research and the workshops with my team, I summarised 5 main design attributes.
Some of them are not identified in the workshop but displays potential value from desk research.
Design Iterations
From iteration 1 to 2, there has been increased level of feature completion and interface fidelity, while iteration 3 focuses on a supplementary feature on top of iteration 2, so it is delivered and evaluated quickly.
Formative evaluation is my major approach of feature value validation, which I walked through all design interfaces with target users with detailed explanation, and collected constructive feedback from them.
Final Design Delivery
1 - Pipeline Designer Side Panels
Side panel tabs are in correspondence with the project hub. It's dynamic, organised, and simplistic.
2 - Node Grouping and Metanode
The grouped 'node section' can be published with as a reusable asset 'metanode' with selection of visibility range and pre-assigned settings.
(The canvas dragging action can't be simulated in the prototype so only the outcome is displayed)
3 - In-Built Comments
Users are allowed to comment in 3 levels of granularity - node, node section, and entire pipeline. Comment history can also be checked from the comment thread.
4 - Normal pipeline, integration pipeline, and personal draftspace
Normal pipeline is for data science team's internal experimentation, integration pipeline is for final delivery & stakeholder communication, personal draftspace for user's individual practice.
5 - Compare View and ML Performance Evaluation Metrics
Users can compare the current pipeline with another one and compare ML performance through a detailed evaluation report.
Usability Testing
With the validation of feature value, finally I also tested the usability of the design, to check whether everything is considered easy to use and visually pleasing.
Implications
Satisfactory visuals & usability: With average rating of 8.1 and 7.8 (out of 10) respectively
Effectiveness of pre-training: Previous knowledge about what is SBM & how to use it significantly improve task success rate
Space for Improvement: Certain functions are hard to find, so the navigation path can be further improved
Reflections
Problems Encountered & How I Solved:
Absence of Mentor & Non-responding Professor: My situation in this internship has been unique. My mentor was in sick leave since my day 1 of internship and my thesis instructor was always too busy to respond me. I had no prior experience working in such highly technical project so there were plenty of things I need to learn.
Lack of UX Maturity within the Company: I was actually the first designer recruited in the team, and the engineers have no prior experience collaborating with a designer. In a long time, they thought I just make beautiful visuals. In this sense, I always need to share my thoughts and my direction to help them get aligned.
Key Learnings:
Innovate through Scientific Research: I found it hard to imagine the workflow of data scientists and how they collaborate within a team. I managed to gain deep understanding about their behaviour and pain points through reading academic research papers, leading to constructive proposed solutions.
Thrive with Proactivity: My leader and teammates had no idea what was my role and what I needed. I displayed proactivity to always share my ideas, ask them questions, and organise meetings with them.
Workshop Facilitation: It was my first time organising workshop for multiple roles. I discovered the effectiveness to always prepare simplistic and visual materials as the baseline of discussion.
Next Step:
Explore the Inclusion of AutoML functionality: AutoML functionality is also an agreed vision of our product, which we have existing resource to develop and implement.
Expand the version control functionality: Version control is considered essential for error recovery and conflict resolution in teamwork, while I had no time to delve deeper during these 6 months.